文章信息
- 虞未江, 贾超, 狄胜同, 袁涵, 朱恒华. 2018.
- YU Wei-jiang, JIA Chao, DI Sheng-tong, YUAN Han, ZHU Heng-hua. 2018.
- 基于模糊数学和改进层次分析法的海水入侵程度评价
- Evaluation of seawater intrusion degree based on fuzzy mathematics and improved analytic hierarchy process
- 海洋科学, 42(6): 19-29
- Marine Sciences, 42(6): 19-29.
- http://dx.doi.org/10.11759/hykx20170904001
-
文章历史
- 收稿日期:2017-09-04
- 修回日期:2018-04-17
2. 山东大学 土建与水利学院, 山东 济南 250061;
3. 山东省地质调查院, 山东 济南 250013
2. School of Civil Engineering, Shandong University, Jinan 250061, China;
3. Shandong Institute of Geological Survey, Jinan 250013, China
海水入侵受地质构造、土壤岩性、含水层渗透性、含水层补给条件等诸多水文地质因素的影响, 其过程较复杂。目前, 海水入侵范围和程度评判的方法主要有数学模型分析、野外调查和数值模拟[1-2]。数学模型分析通过数学方程描述含水层中盐分浓度分布的变化来揭示海水入侵的范围和规律, 数学建模需要考虑许多自然条件和人工因素, 构建过程复杂、难度大; 野外调查需要构建大型地下水三维动态监测网对目标进行长期观测, 投入成本高、耗时长[3-4];数值模拟需要大量高精度的数据资料才能够准确建立复杂的含水层结构和处理复杂的边界条件, 往往由于缺乏数据资料而受到应用限制。此外, 地下水系统在自然和人为因素双重作用下, 存在高度复杂性、非线性、随机性等特征, 使得对海水入侵程度进行完全定量评价和预测分析更加困难[5-6]。事实上, 当得到一个海水入侵程度评价结果比构建实际模型和完全定量评价预测更重要时, 定性与定量相结合的数学分析方法是一条高效可靠的途径。
目前, 常用于海水入侵分析的数学评价方法有单一指标评价法、属性识别法、数理统计法和模糊数学等[6-9]。但这些数学评价方法都存在不同程度的缺陷, 如单一指标评价法的计算结果不稳定、较为片面; 属性识别法需要选择合理的置信度, 否则评价结果会产生较大的误差; 数理统计法的分析结果则易受样本数据的影响、波动较大。而模糊数学综合评价法不仅考虑了海水入侵过程的渐变性和模糊性, 且评价结果较为全面、稳定, 已成为海水入侵现状评价最常用的一种方法。但传统模糊数学法一般都是通过计算超标比来确定各评价指标的权重[7-9], 当评价样本较多时, 每评价一个样本, 就必须计算各评价指标在这个样本中的权重值, 计算量过大。鉴于此, 本文提出一种基于模糊数学和改进层次分析法的海水入侵程度评价模型, 该模型先通过改进层次分析法计算1次, 确定各指标适用于所有评价样本的权重值, 这样既大大地减少了计算量, 又能综合考虑专家们的专业判断, 提高指标权重值的可信度; 然后选择多项合适的评价指标, 运用模糊数学对海水入侵程度进行综合评价。
应用该模型进行海水入侵程度评价, 具体可分为3步: (1)构建基于模糊数学和改进层次分析法的评价模型; (2)选择多项能敏感反映海水入侵过程的水化学指标作为评价指标并划分海水入侵程度等级; (3)结合监测数据, 进行模糊综合评价, 根据最大隶属度原则确定海水入侵程度等级。本文将该模型应用于山东招远市地区海水入侵程度、范围的评价, 并与单一指标评价法的结果进行对比分析, 验证该模型用于评价海水入侵程度的科学合理性。
1 基于模糊数学和改进层次分析法的评价模型模糊数学是研究界限不明确问题的一种数学工具, 被广泛用于模糊性问题的评价。模糊综合评价的过程主要包括构建模糊隶属函数和评判矩阵; 计算模糊积; 依据最大隶属度原则, 确定评价等级等3个步骤。
层次分析法是一种定性与定量相结合的数学分析方法, 是评价多层递阶大系统的一种简易高效的途径, 而随着评价结果要求的提高, 传统层次分析法的缺点越发明显[10-12]。主要问题就是主观因素的参与, 集中表现在判断矩阵一致性的反复多次检验和调整[13]。本文从专家判断信息筛选和综合判断矩阵构造方式等两个方面对层次分析方法进行改进, 首先利用一致性比例CR对N(N > 3)名专家构造的判断矩阵进行筛选, 并对筛选后的矩阵进行可信度检验; 然后选择通过可信度检验的专家判断矩阵, 运用几何平均方法构造综合判断矩阵, 并对综合判断矩阵进行一致性比例检验, 最终构造一个准确可信的综合判断矩阵。
1.1 构建评价对象的因素指标集所有评价对象组成的有限集合X, X={x1, x2, …, xn}, X中的元素xj(j=1, 2, …, n)表示第j个评价对象。所有评价指标组成的有限集合K, K={k1, k2, …, km}, K中的元素ki(i=1, 2, …, m)表示第i个评价指标。
1.2 确定指标权重随机选择该领域的N(N > 3)名专家, 专家们运用1~9重要性标度对各层次评价指标两两相对重要性程度进行比较并构造比较判断矩阵A1, A2, …, AN。计算各判断矩阵的CR, 并根据实际情况, 假定一检验标准T[10], 若存在CR大于检验标准T的判断矩阵, 则认为该判断矩阵存在误差, 需重新判断或者直接剔除。参考文献[14], 进一步计算筛选后矩阵的可信度, 对可信度不高的矩阵需予以调整或删除, 以保证综合判断矩阵的一致性。
在对专家比较判断信息筛选的基础上, 采用几何平均法构建综合判断矩阵A。几何平均法受数据极端值的影响较小, 可有效降低随机波动因素的影响, 从而反映数据的总体水平。通过计算A的一致性比例, 分析A构造过程中的随机性对计算结果精度的影响, 若一致性比例满足要求, 则认为A可用于后续计算; 否则, 需重新调整计算。
根据专家判断构建的比较判断矩阵和综合判断矩阵A的最大特征值与对应的特征向量计算, 本文通过和积法计算确定, 具体的计算和指标权向量一致性检验的计算, 文献[10]—[13]中已有详细的介绍, 这里不再赘述。通过改进层次分析法计算评价指标权重, 可避免反复调整CR。
1.3 建立单项指标评判矩阵构建模糊函数ui, 令ui是第i个评价指标
| $\mathit{\boldsymbol{R}} = {\left( {{r_{ij}}} \right)_{m \times n}} = \left[ {\begin{array}{*{20}{c}} {{r_{11}}}&{{r_{12}}}& \cdots &{{r_{1n}}}\\ {{r_{21}}}&{{r_{22}}}& \cdots &{{r_{2n}}}\\ \vdots&\vdots&\ddots&\vdots \\ {{r_{m1}}}&{{r_{m2}}}& \cdots &{{r_{mn}}} \end{array}} \right]$ | (1) |
式中, rij=R(xj, ui)
评价指标权重W和评判矩阵R相乘即可得到评价结果B, 计算公式如下:
| $\mathit{\boldsymbol{B}} = \mathit{\boldsymbol{WR}} = \left( {{b_1}, {b_2}, \cdots , {b_n}} \right), \;\;{b_j} \in \left[ {0, 1} \right]$ | (2) |
B中元素bj (j=1, 2, …, n)表示第j个评价对象的综合评价指数, 根据最大隶属度原则判断综合评价指数, 最终确定评价结果的等级[15-16]。
2 海水入侵地下水水化学指标地下水水化学特征是评价沿海地区海水入侵程度的主要依据。海水入侵致使沿海区域地下水水质恶化, 最突出的变化是地下水中m(Cl–)(即地下水中Cl–的质量浓度)明显增高, 所以通常采用以Cl–作为评价因子的单指标评价法来研究海水入侵, 或以m(Cl–)结合地下水矿化度构成双项组合指标来评价海水入侵程度。但海咸水入侵是随机变化的动态过程, 将诱发包含Cl–在内的一系列水化学反应, 且含水层中m(Cl–)、矿化度等水化学指标易受工业污水、农业灌溉等其他因素的影响。故仅考虑1、2个等少量因素来评价海水入侵程度是不全面的, 必须选择多种水化学指标对海水入侵程度进行综合评价, 提高评价结果的可靠度。目前, 用于评价海水入侵的水化学指标主要有m(Cl–)、m(Br–)、m(SO42–)、m(K+)、m(HCO 3–)/m(Cl–)、矿化度、钠吸附比、硝酸盐、电导率、溶解性总固体和潜在盐度等[7-9, 17-22]。结合该区实际情况[20-22], 本文选择m(Cl–)、m(Br–)、m(SO42–)、m(K+)、SAR等5项指标对海水入侵程度进行综合评价。其中, 由Na+、Mg2+、Ca2+等3种离子构成的钠吸附比(SAR)不仅可以评价海水入侵程度, 还能考量土壤次生碱化程度, 是评价海水入侵程度的一项合理的水化学指标, 其计算公式如下:
| $ {\rm{SAR}} = m({\rm{N}}{{\rm{a}}^{\rm{ + }}})/\sqrt {0.5[m({\rm{C}}{{\rm{a}}^{{\rm{2 + }}}}) + m({\rm{M}}{{\rm{g}}^{{\rm{2 + }}}})]} $ | (3) |
式中, m表示各离子质量浓度, 单位为(mg/L)1/2。
划分海水入侵程度等级和确定各项指标分级标准。沿海区域地下淡水按被海水入侵污染程度轻重可以分为淡水、微咸水、咸水和盐水等4种。本文将沿海区域海水入侵程度共划分为5级, 其中, 在微咸水处划分3级以重点表现海水入侵过程中过渡带的变化, 如表 1所示。
| 等级 | 入侵程度 | 水质类型 |
| Ⅰ级 | 基本无入侵 | 影响淡水 |
| Ⅱ级 | 轻度入侵 | 轻度微咸水 |
| Ⅲ级 | 中度入侵 | 中度微咸水 |
| Ⅳ级 | 较严重入侵 | 重度微咸水 |
| Ⅴ级 | 严重入侵 | 咸水及盐水 |
依据国内地下水质量标准和参照已有的指标分级研究成果[17-19], 本文对海水入侵程度评价指标进行分级, 如表 2所示。
| 等级 | m/(mg/L) | SAR | |||
| Cl– | Br– | SO42– | K+ | ||
| Ⅰ级 | 100 | 0.2 | 80 | 2.5 | 1.0 |
| Ⅱ级 | 250 | 1.2 | 200 | 5.0 | 2.0 |
| Ⅲ级 | 350 | 2.4 | 300 | 10 | 3.0 |
| Ⅳ级 | 500 | 3.6 | 450 | 20 | 4.5 |
| Ⅴ级 | 800 | 9.0 | 600 | 40 | 12.0 |
本文选择山东省招远市作为研究区, 对评价模型进行实例应用。研究区位于我国海水入侵较严重的莱州湾地区, 该地区淡水资源紧缺, 普遍超量开采地下水弥补用水需求, 致使地下水位逐年降低, 出现大面积的海水入侵区域。
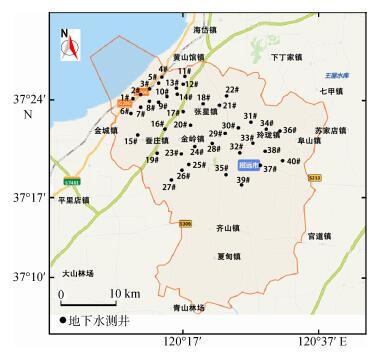
为保证研究区海水入侵程度评价结果的准确性, 本文对距海岸线不同距离和监测不同地下水类型的40个地下水水质监测井进行取样分析, 且各监测井在采样前连续抽水30min以减少采样过程中人为因素的影响。各地下水监测井站位如图 1所示。
 |
| 图 1 各地下水监测井站位示意图 Fig. 1 The schematic diagram of the locations for all groundwater monitoring wells |
各监测井距海岸线距离, 取样的地下水类型和各监测指标含量如表 3所示, 表中L表示各地下水水质监测井距海岸线的距离, 单位为km。
| 监测井号 | L/km | 地下水类型 | m/(mg/L) | SAR | ||||||
| Cl– | Br– | SO42– | Na+ | Ca2+ | Mg2+ | K+ | ||||
| 1# | 2.2 | 潜水 | 743.85 | 15.31 | 637.95 | 13.76 | 10.75 | 6.54 | 47.1 | 4.68 |
| 2# | 2.6 | 承压水 | 588.64 | 11.08 | 472.20 | 6.82 | 8.52 | 3.12 | 24.7 | 4.47 |
| 3# | 2.9 | 潜水 | 653.37 | 13.25 | 483.77 | 11.30 | 9.59 | 2.82 | 35.4 | 4.54 |
| 4# | 3.1 | 潜水 | 696.09 | 14.64 | 441.57 | 9.63 | 9.15 | 2.03 | 40.5 | 6.44 |
| 5# | 3.4 | 承压水 | 601.54 | 4.36 | 365.29 | 6.03 | 8.85 | 1.86 | 15.5 | 4.12 |
| 6# | 4.0 | 承压水 | 533.77 | 13.50 | 408.36 | 8.38 | 8.01 | 2.65 | 3.6 | 5.74 |
| 7# | 4.2 | 潜水 | 633.40 | 10.16 | 411.05 | 11.70 | 8.86 | 3.55 | 16.6 | 4.70 |
| 8# | 4.6 | 潜水 | 730.41 | 12.84 | 385.13 | 8.95 | 12.22 | 3.01 | 33.5 | 5.13 |
| 9# | 6.2 | 承压水 | 420.23 | 3.17 | 189.87 | 5.48 | 17.51 | 2.31 | 7.8 | 1.74 |
| 10# | 6.3 | 承压水 | 353.77 | 2.28 | 409.31 | 5.49 | 22.25 | 3.38 | 2.5 | 1.53 |
| 11# | 6.5 | 潜水 | 204.49 | 3.77 | 248.19 | 7.73 | 7.43 | 3.87 | 29 | 3.25 |
| 12# | 6.7 | 潜水 | 578.01 | 6.91 | 479.34 | 9.87 | 5.96 | 3.04 | 44.3 | 4.65 |
| 13# | 7.1 | 潜水 | 283.27 | 3.48 | 328.14 | 7.43 | 6.46 | 2.57 | 12.1 | 3.50 |
| 14# | 7.5 | 潜水 | 384.39 | 3.31 | 375.39 | 8.91 | 4.38 | 2.93 | 4.6 | 4.66 |
| 15# | 8.4 | 承压水 | 311.26 | 2.45 | 305.32 | 5.90 | 7.14 | 2.01 | 3.8 | 2.76 |
| 16# | 11.0 | 潜水 | 425.99 | 3.81 | 262.09 | 7.45 | 5.07 | 2.99 | 8.7 | 3.71 |
| 17# | 11.1 | 潜水 | 352.55 | 2.83 | 219.97 | 8.63 | 8.48 | 3.40 | 15.5 | 3.54 |
| 18# | 12.7 | 承压水 | 182.25 | 2.16 | 340.38 | 4.26 | 7.16 | 3.33 | 6.5 | 1.86 |
| 19# | 13.1 | 承压水 | 218.38 | 1.56 | 244.21 | 4.00 | 5.67 | 2.11 | 3.6 | 2.03 |
| 20# | 13.7 | 潜水 | 289.36 | 2.73 | 336.62 | 9.11 | 7.88 | 2.59 | 6.9 | 3.98 |
| 21# | 15.3 | 潜水 | 213.49 | 2.33 | 141.25 | 4.78 | 5.24 | 3.61 | 4.5 | 2.27 |
| 22# | 15.4 | 潜水 | 361.22 | 3.31 | 297.25 | 5.51 | 3.23 | 2.14 | 47.5 | 3.36 |
| 23# | 16.3 | 潜水 | 272.72 | 2.58 | 226.02 | 4.78 | 3.23 | 1.18 | 5.1 | 3.22 |
| 24# | 17.2 | 承压水 | 115.54 | 1.17 | 245.45 | 1.20 | 2.68 | 0.79 | 3.2 | 0.91 |
| 25# | 18.7 | 潜水 | 291.20 | 1.96 | 960.94 | 11.74 | 12.83 | 4.51 | 5.2 | 3.99 |
| 26# | 18.8 | 承压水 | 69.26 | < 0.1 | 35.84 | 4.30 | 5.35 | 2.59 | 6.5 | 2.16 |
| 27# | 19.0 | 承压水 | 315.94 | 1.03 | 345.01 | 4.75 | 14.22 | 4.68 | 3.4 | 1.54 |
| 28# | 19.1 | 承压水 | 283.42 | 0.85 | 250.08 | 6.04 | 12.10 | 5.69 | 0.8 | 2.03 |
| 29# | 19.2 | 潜水 | 260.53 | 1.34 | 284.81 | 4.30 | 7.86 | 5.30 | 1.5 | 1.68 |
| 30# | 20.7 | 潜水 | 102.25 | 1.01 | 108.83 | 2.70 | 4.74 | 1.01 | 1.4 | 1.59 |
| 31# | 22.0 | 潜水 | 160.08 | 0.89 | 305.65 | 3.22 | 7.92 | 2.31 | 1.8 | 1.42 |
| 32# | 24.5 | 承压水 | 115.54 | < 0.1 | 472.37 | 4.46 | 7.58 | 4.00 | 5.2 | 1.85 |
| 33# | 24.7 | 承压水 | 175.86 | < 0.1 | 525.62 | 9.22 | 8.14 | 3.72 | 1.7 | 3.78 |
| 34# | 25.1 | 承压水 | 72.59 | < 0.1 | 567.30 | 4.09 | 7.14 | 3.66 | 5.2 | 1.76 |
| 35# | 25.2 | 潜水 | 262.77 | < 0.1 | 233.87 | 8.13 | 5.69 | 3.66 | 40.5 | 3.76 |
| 36# | 26.2 | 潜水 | 259.71 | 0.93 | 187.99 | 5.12 | 6.32 | 5.02 | 3.5 | 2.15 |
| 37# | 27.5 | 承压水 | 112.47 | < 0.1 | 29.18 | 3.06 | 4.95 | 1.61 | 0.9 | 1.69 |
| 38# | 27.8 | 承压水 | 200.40 | < 0.1 | 84.75 | 5.00 | 7.53 | 2.04 | 1.2 | 2.29 |
| 39# | 28.5 | 承压水 | 135.99 | < 0.1 | 42.5 | 4.46 | 2.62 | 2.30 | 2.5 | 2.84 |
| 40# | 31.7 | 潜水 | 184.04 | < 0.1 | 92.62 | 3.48 | 4.56 | 2.48 | 1.6 | 1.85 |
研究区海水入侵程度评价指标为m(Cl–)、m(Br–)、m(SO42–)、m(K+)、SAR等5项水化学指标, 评价等级为上述海水入侵程度的5个等级, 评价标准即各水化学指标的分级标准。设论域K={m(Cl–)、m(Br–)、m(SO42–)、m(K+)、SAR}为各评价指标含量的集合, X={Ⅰ, Ⅱ, Ⅲ, Ⅳ, Ⅴ}是海水入侵程度分级的集合, 并根据评价模型中的计算过程确定指标权重。
邀请10位该领域专家对评价指标两两重要性程度进行比较, 并构造比较判断矩阵A:
各比较判断矩阵A的最大特征值
| A | |
CR |
| A1 | 5.271 | 0.060 |
| A2 | 5.265 | 0.059 |
| A3 | 5.159 | 0.035 |
| A4 | 5.217 | 0.048 |
| A5 | 5.220 | 0.049 |
| A6 | 5.132 | 0.029 |
| A7 | 6.985 | 0.443 |
| A8 | 5.177 | 0.040 |
| A9 | 5.872 | 0.195 |
| A10 | 6.656 | 0.370 |
利用CR筛选专家判断信息, 再构造综合判断矩阵。假定检验标准T=0.2, 认为CR>0.2的判断矩阵存在明显的逻辑错误, 应删除; 认为0.1<CR<0.2的判断矩阵误差较小, 通过构建综合判断矩阵能有效降低主观因素的影响, 可保留。由表 4可知, 矩阵A7、A9、A10的一致性比例大于0.1, CR7=0.443>0.2, 0.1<CR9=0.195<0.2, CR10=0.370>0.2。故将A7和A10删除, 并参考文献[14], 对剩余的矩阵进行可信度计算。经计算, 矩阵A1、A2、A3、A4、A5、A6、A8、A9的差异度
矩阵A的最大特征值
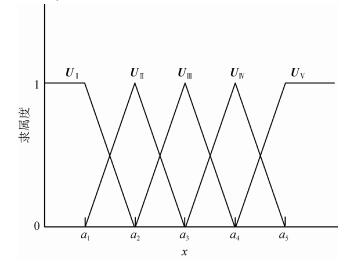
单项指标模糊评价是多因素模糊综合评价的基础, 主要分为两步: (1)构建模糊隶属函数; (2)计算隶属度并建立评判矩阵。本文选择模糊分布法中的梯形分布来构建指标的隶属函数和计算其隶属度, 如图 2所示。
 |
| 图 2 根据模糊分布法中梯形分布构建的评价指标模糊隶属函数 Fig. 2 Fuzzy membership function of the evaluation index based on the trapezoidal distribution in the fuzzy distribution method |
图中
同理, 其他评价指标对各级海水入侵程度的模糊隶属函数依此构建。以1#监测井为例, 基于模糊隶属函数和被评价指标的实测浓度值xi, 分别计算各指标对Ⅰ、Ⅱ、Ⅲ、Ⅳ、Ⅴ级海水入侵程度的隶属度ui, 根据评价结果可得到一个5×5阶的评判矩阵R。
依此类推, 可以求出其他39个监测井海水入侵程度各项评价指标的隶属度和评判矩阵。
3.4 模糊综合评价1#监测井的评价结果B等于W和R相乘, 如下:
对评价结果进行归一化处理, 可得B=[0 0 0 0.324 0.676], 依据模糊数学最大隶属度原则可知, 1#监测井海水入侵程度等级为Ⅴ级, 严重入侵。其他监测井照此过程计算, 计算结果如表 5所示。
| 井号 | 隶属度矩阵 |
| 1# | [0 0 0 0.324 0.676] |
| 2# | [0 0 0.028 0.422 0.500] |
| 3# | [0 0 0 0.434 0.566] |
| 4# | [0 0 0.075 0.401 0.524] |
| 5# | [0 0 0 0.203 0.451 0.346] |
| 6# | [0.058 0.058 0.096 0.342 0.446] |
| 7# | [0 0 0.109 0.387 0.504] |
| 8# | [0 0 0.119 0.329 0.552] |
| 9# | [0.160 0.160 0.325 0.355 0] |
| 10# | [0.213 0.213 0.472 0.102 0] |
| 11# | [0.246 0.246 0.145 0.321 0.042] |
| 12# | [0 0 0 0.498 0.502] |
| 13# | [0 0.270 0.270 0.460 0] |
| 14# | [0.063 0.063 0.368 0.480 0.026] |
| 15# | [0.065 0.382 0.499 0.054 0] |
| 16# | [0 0.103 0.368 0.480 0.049] |
| 17# | [0 0.101 0.469 0.430 0] |
| 18# | [0.279 0.279 0.364 0.078 0] |
| 19# | [0.234 0.433 0.333 0 0] |
| 20# | [0 0.310 0.405 0.285 0] |
| 21# | [0.254 0.323 0.423 0 0] |
| 22# | [0 0.036 0.389 0.508 0.067] |
| 23# | [0 0.356 0.465 0.179 0] |
| 24# | [0.387 0.505 0.108 0 0] |
| 25# | [0 0.361 0.383 0.173 0.083] |
| 26# | [0.538 0.242 0.220 0 0] |
| 27# | [0.185 0.411 0.315 0.089 0] |
| 28# | [0.337 0.375 0.288 0 0] |
| 29# | [0.258 0.571 0.171 0 0] |
| 30# | [0.434 0.566 0 0 0] |
| 31# | [0.369 0.481 0.104 0.046 0] |
| 32# | [0.503 0.227 0.052 0.109 0.109] |
| 33# | [0.347 0.266 0.156 0.156 0.075] |
| 34# | [0.532 0.240 0 0.114 0.114] |
| 35# | [0.357 0.274 0.161 0.161 0.047] |
| 36# | [0.333 0.481 0.186 0 0] |
| 37# | [0.689 0.311 0 0 0] |
| 38# | [0.451 0.346 0.203 0 0] |
| 39# | [0.484 0.298 0.218 0 0] |
| 40# | [0.566 0.434 0 0 0] |
为验证和说明评价结果的可靠性、合理性, 本文采用单一指标评价法, 即仅以m(Cl–)作为评价因子, 运用图 1所示的模糊隶属函数对各监测井的海水入侵程度进行计算评价, 两种方法的海水入侵程度评价结果对比如表 6所示, 表中F-改进AHP评价是基于模糊数学和改进层次分析法评价的简称。
| 监测井号 | 单一指标评价 | F-改进AHP评价 |
| 1# | Ⅴ | Ⅴ |
| 2# | Ⅳ | Ⅴ |
| 3# | Ⅴ | Ⅴ |
| 4# | Ⅴ | Ⅴ |
| 5# | Ⅳ | Ⅳ |
| 6# | Ⅳ | Ⅴ |
| 7# | Ⅳ | Ⅴ |
| 8# | Ⅴ | Ⅴ |
| 9# | Ⅲ | Ⅳ |
| 10# | Ⅲ | Ⅲ |
| 11# | Ⅱ | Ⅳ |
| 12# | Ⅳ | Ⅴ |
| 13# | Ⅱ | Ⅲ |
| 14# | Ⅳ | Ⅳ |
| 15# | Ⅲ | Ⅲ |
| 16# | Ⅳ | Ⅳ |
| 17# | Ⅲ | Ⅲ |
| 18# | Ⅱ | Ⅲ |
| 19# | Ⅱ | Ⅱ |
| 20# | Ⅱ | Ⅲ |
| 21# | Ⅱ | Ⅲ |
| 22# | Ⅲ | Ⅳ |
| 23# | Ⅱ | Ⅲ |
| 24# | Ⅰ | Ⅱ |
| 25# | Ⅱ | Ⅲ |
| 26# | Ⅰ | Ⅰ |
| 27# | Ⅲ | Ⅱ |
| 28# | Ⅱ | Ⅱ |
| 29# | Ⅱ | Ⅱ |
| 30# | Ⅰ | Ⅱ |
| 31# | Ⅰ | Ⅱ |
| 32# | Ⅰ | Ⅰ |
| 33# | Ⅱ | Ⅰ |
| 34# | Ⅰ | Ⅰ |
| 35# | Ⅱ | Ⅰ |
| 36# | Ⅱ | Ⅱ |
| 37# | Ⅰ | Ⅰ |
| 38# | Ⅱ | Ⅰ |
| 39# | Ⅰ | Ⅰ |
| 40# | Ⅱ | Ⅰ |
根据表 6中各监测井海水入侵程度评价的对比结果, 作两种方法的海水入侵程度评价结果对比图, 如图 3所示。
 |
| 图 3 两种方法的海水入侵程度评价结果对比图 Fig. 3 Comparison of two methods for evaluating seawater intrusion degree |
分析图 3可知, 本文模型的评价结果与单一指标法的结果基本一致, 变化趋势相同。但以26#监测井(距海岸线距离为18.8 km)为界限, 在距海岸线小于18.8 km范围内, 单一指标法的评价结果较本文模型的评价结果略偏小; 而距海岸线大于18.8 km处, 单一指标法的评价结果又略偏大。分析评价结果不同的原因可能是在距海岸线小于18.8 km范围内, 海水入侵引发该区含水层中各种离子发生复杂的水化学反应, m(Cl–)不是最主要的评价指标, 仅用m(Cl–)评价会丢失信息, 造成评价结果偏小; 距海岸线大于18.8km的各地下水监测井, 受海水入侵影响较小, 但受工农业、生活污水影响, m(Cl–)偏高, 故该范围仅用m(Cl–)评价, 会使评价结果片面、偏大。而本文模型结合研究区实际情况, 选择多项评价指标对海水入侵程度进行综合评价, 使评价结果更为全面、稳定、可信, 可有效反映该区海水入侵的现状。
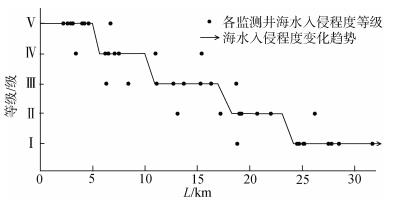
基于模型评价结果, 研究分析该地区的海水入侵程度、范围, 以及海水在不同类型含水层中的入侵状况。根据表 3中各监测井距海岸线的距离和表 6中各监测井海水入侵程度的评价结果, 作各监测井海水入侵程度等级散点图, 研究海水入侵程度变化趋势, 如图 4所示。
 |
| 图 4 研究区各监测井海水入侵程度等级散点图 Fig. 4 Scatter point map of seawater intrusion level in each monitoring well in the study area |
由图 4可知, 研究区海水入侵程度与距海岸线的距离呈明显的阶梯形分布, 距海岸线越近, 海水入侵程度越严重, 0~5 km范围内, 海水入侵程度等级基本为Ⅴ级, 属于严重入侵, 地下水水质类型为咸水或盐水; 5~10 km范围内以Ⅳ级较严重入侵为主; 10~15 km范围内主要是Ⅲ级中度入侵; 15~20 km区域内海水入侵程度等级大多为Ⅲ级和Ⅱ级; 距海岸线距离大于20 km的地区受海水入侵影响较小, 入侵程度等级以Ⅰ级基本无入侵和Ⅱ级轻度入侵为主, 地下水水质类型为影响淡水和轻度微咸水。
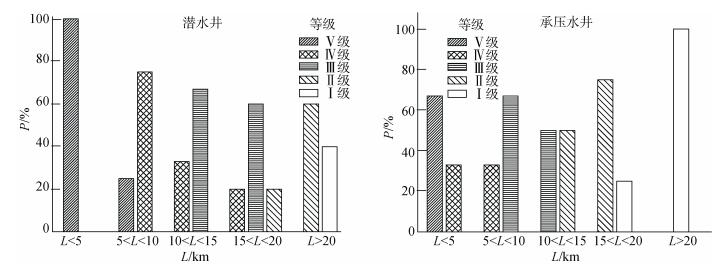
根据表 3中各个井监测的地下水类型和表 6中各监测井海水入侵程度的评价结果, 作距海岸线不同距离段, 不同海水入侵程度等级的监测井个数占同距离段同地下水类型监测井总个数的百分比示意图, 如图 5所示。图中P表示距海岸线不同距离段, 不同海水入侵程度等级的潜水(承压水)监测井数量占同距离段潜水(承压水)监测井总数的百分比。
 |
| 图 5 距海岸线不同距离段, 不同海水入侵程度等级的监测井数量占同距离段同地下水类型监测井总数的百分比 Fig. 5 The number of monitoring wells with different levels of seawater intrusion in different distances from the coastline as a percentage of the total number of monitoring wells of the same distance and groundwater types |
分析图 5可知, 距海岸线相同距离段, 潜水层比承压水层更易受海水入侵影响, 承压水层的海水入侵程度普遍比潜水层的低。因此, 可以预测, 该地区若无切实有效的措施防治海水入侵, 海水将在研究区地下含水层中继续向内陆运移, 距海岸线5~10 km地区潜水层内海水严重入侵区面积将明显增加, 海水Ⅴ级严重入侵区将从目前的0~5 km逐渐发展到5~10 km区域, 0~5 km范围内的承压水层也将全部变为海水Ⅴ级严重入侵区, 其他区域海水入侵程度等级也将逐渐提高, 严重污染当地地下水资源。
4 结论本文选取m(Cl–)、m(Br–)、m(SO42–)、m(K+)、SAR等5项能够敏感反映该区海水入侵过程的水化学指标作为评价指标, 并根据各指标重要性程度赋予不同的权重值, 综合考虑海水入侵程度评价的主要指标和其他次要指标, 客观实际地反映海水入侵过程。由改进层次分析法计算结果可知, 研究区海水入侵程度评价的主要指标是m(Br–)和m(Cl–), 其他地区应根据当地海水入侵特点, 合理选择评价指标。
基于模糊数学和改进层次分析法构建的评价模型能够客观反映海水入侵程度等级的模糊性和连续性, 通过改进层次分析法和矩阵可信度检验, 计算指标权重, 可避免主观因素对评价结果的影响, 提高评价结果的可信度。运用该模型对研究区海水入侵程度进行评价, 并与单一指标法评价结果对比, 结果表明:本文模型。
对大量水质样本的数学分析是运用该模型评价海水入侵程度的核心步骤, 通过MATLAB、FORTRAN、EXCEL等软件编制程序, 将繁琐复杂的数学计算简化为算术和逻辑运算, 使该模型成为海水入侵程度评价的一种简易高效、科学合理的方法。
| [1] |
郭占荣, 黄奕普. 海水入侵问题研究综述[J]. 水文, 2003, 23(3): 10-15, 9. Guo Zhanrong, Huang Yipu. Comprehensive study on seawater intrusion[J]. Hydrology, 2003, 23(3): 10-15, 9. DOI:10.3969/j.issn.1000-0852.2003.03.003 |
| [2] |
丁玲, 李碧英, 张树深. 海岸带海水入侵的研究进展[J]. 海洋通报, 2004, 23(2): 82-87. Ding Ling, Li Biying, Zhang Shushen. Development in researches on seawater intrusion of coastal areas[J]. Marine Science Bulletin, 2004, 23(2): 82-87. DOI:10.3969/j.issn.1001-6392.2004.02.013 |
| [3] |
王玉广, 刘娟, 张永华, 等. 辽东湾西部滨海地区海水入侵研究[J]. 海洋工程, 2010, 28(1): 83-87, 92. Wang Yuguang, Liu Juan, Zhang Yonghua, et al. Sea water invasion in west coast of Liaodong Bay[J]. The Ocean Engineering, 2010, 28(1): 83-87, 92. DOI:10.3969/j.issn.1005-9865.2010.01.013 |
| [4] |
张德君, 李雪铭, 单灵芝, 等. 海水入侵对滨海城市化发展的影响研究:以大连市为例[J]. 辽宁师范大学学报(自然科学版), 2014, 37(3): 422-430. Zhang Dejun, Li Xueming, Shan Lingzhi, et al. The influence of seawater intrusion in coastal urbanization: a case of Dalian[J]. Journal of Liaoning Normal University (Natural Science Edition), 2014, 37(3): 422-430. |
| [5] |
杨吉龙, 李红, 施佩歆, 等. 环渤海典型地段海(咸)水入侵研究现状及方法探讨[J]. 地质调查与研究, 2014, 37(4): 294-299, 320. Yang Jilong, Li Hong, Shi Peixin, et al. Research status and discussion on the method of seawater intrusion in the key section of Circum-Bohai-Sea Region[J]. Geological Survey and Research, 2014, 37(4): 294-299, 320. DOI:10.3969/j.issn.1672-4135.2014.04.010 |
| [6] |
杨蕴, 吴剑锋, 林锦, 等. 控制海水入侵的地下水多目标模拟优化管理模型[J]. 水科学进展, 2015, 26(4): 579-588. Yang Yun, Wu Jianfeng, Lin Jin, et al. A multi-objective simulation-optimization model constrained by the potential seawater intrusion[J]. Advances in Water Sciences, 2015, 26(4): 579-588. |
| [7] |
涂向阳, 高学平. 模糊数学在海水入侵地下水水质评价中的应用[J]. 水利学报, 2003, 34(8): 64-69. Tu Xiangyang, Gao Xueping. Application of fuzzy mathematical method in evaluation of seawater intrusion[J]. Journal of Hydraulic Engineering, 2003, 34(8): 64-69. DOI:10.3321/j.issn:0559-9350.2003.08.013 |
| [8] |
乔吉果, 龙江平, 许冬, 等. 基于模糊数学方法的长江三角洲滨海地区海水入侵现状评价[J]. 海洋学研究, 2011, 29(4): 57-64. Qiao Jiguo, Long Jiangping, Xu Dong, et al. Evaluation for the present status of seawater intrusion in the coastal areas of Changjiang River Delta with fuzzy mathematical method[J]. Journal of Marine Sciences, 2011, 29(4): 57-64. DOI:10.3969/j.issn.1001-909X.2011.04.008 |
| [9] |
章斌, 宋献方, 韩冬梅, 等. 运用数理统计和模糊数学评价秦皇岛洋戴河平原的海水入侵程度[J]. 地理科学, 2013, 33(3): 342-348. Zhang Bin, Song Xianfang, Han Dongmei, et al. Seawater intrusion degree evaluation based on mathematical statistics and fuzzy mathematics in Qinhuangdao Yangdai River Plain[J]. Scientia Geographica Sinica, 2013, 33(3): 342-348. |
| [10] |
杨海涛, 马东堂. 层次分析法中判断矩阵的一致性研究[J]. 现代电子技术, 2007, 19(3): 46-48. Yang Haitao, Ma Dongtang. Study on the consistence of judgement matrix in AHP[J]. Modern Electronics Technique, 2007, 19(3): 46-48. DOI:10.3969/j.issn.1004-373X.2007.03.016 |
| [11] |
夏正洪, 王俊峰. 一种改进的层次分析法及其在效能评估中的应用[J]. 四川大学学报(自然科学版), 2010, 47(1): 71-76. Xia Zhenghong, Wang Junfeng. An improved analytic hierarchy process and its application in performance evaluation[J]. Journal of Sichuan University (Natural Science Edition), 2010, 47(1): 71-76. DOI:10.3969/j.issn.0490-6756.2010.01.014 |
| [12] |
杜淼. 两类层次分析法的转换及在应用中的比较[J]. 计算机工程与应用, 2012, 48(9): 114-119. Du Miao. Transformation from AHP to FAHP and their applications[J]. Computer Engineering and Applications, 2012, 48(9): 114-119. DOI:10.3778/j.issn.1002-8331.2012.09.034 |
| [13] |
朱克毓, 杨善林. 关于Saaty对模糊逻辑不适用于AHP观点的评述[J]. 系统工程理论与实践, 2014, 34(1): 197-206. Zhu Keyu, Yang Shanlin. Research review on Saaty's comments on fuzzy logic is not applicable to analytical hierarchy process[J]. Systems Engineering-Theory & Practice, 2014, 34(1): 197-206. |
| [14] |
秦学志, 王雪华, 杨德礼. AHP中群组评判的可信度法(Ⅱ)[J]. 系统工程理论与实践, 2000, 11(5): 76-79, 144. Qin Xuezhi, Wang Xuehua, Yang Deli. Credit degree methods of group decision-making in AHP (Ⅱ)[J]. Systems Engineering-Theory & Practice, 2000, 11(5): 76-79, 144. DOI:10.3321/j.issn:1000-6788.2000.05.014 |
| [15] |
王新民, 赵彬, 张钦礼. 基于层次分析和模糊数学的采矿方法选择[J]. 中南大学学报(自然科学版), 2008, 39(5): 875-880. Wang Xinmin, Zhao Bin, Zhang Qinli. Mining method choice based on AHP and fuzzy mathematics[J]. Journal of Central South University (Science and Technology), 2008, 39(5): 875-880. |
| [16] |
魏炜, 岳丹丹, 潘俊. 基于层次分析的模糊综合评价法在水质评价中的应用[J]. 供水技术, 2015, 9(5): 8-12. Wei Wei, Yue Dandan, Pan Jun. Application of fuzzy comprehensive method based on analytic hierarchy process in water quality evaluation[J]. Water Technology, 2015, 9(5): 8-12. DOI:10.3969/j.issn.1673-9353.2015.05.002 |
| [17] |
张文杰, 谭红兵, 陈喜, 等. 广东硇洲岛地下水化学演化及成因机理[J]. 水文, 2012, 32(3): 51-59. Zhang Wenjie, Tan Hongbing, Chen Xi, et al. Geo-chemical evolution and formation mechanism of groundwater in Naozhou Island Guangdong Province[J]. Journal of China Hydrology, 2012, 32(3): 51-59. DOI:10.3969/j.issn.1000-0852.2012.03.010 |
| [18] |
李亮, 邢怀学, 常晓军, 等. 福建长乐地区海水入侵(上溯)对水化学变化的影响[J]. 现代地质, 2015, 29(2): 344-350. Li Liang, Xing Huaixue, Chang Xiaojun, et al. Water chemical changes with seawater intrusion (upstream) in Changle City, Fujian Province[J]. Geoscience, 2015, 29(2): 344-350. DOI:10.3969/j.issn.1000-8527.2015.02.018 |
| [19] |
孙振宇, 宋献方, 卜红梅, 等. 秦皇岛洋河-戴河流域浅层地下水咸化程度评价[J]. 安全与环境学报, 2015, 15(3): 356-361. Sun Zhenyu, Song Xianfang, Bu Hongmei, et al. Assessment of the shallow groundwater salinization in the Yanghe & Daihe River basin near Qinhuangdao[J]. Journal of Safety and Environment, 2015, 15(3): 356-361. |
| [20] |
郭笃发. 莱州湾东南岸海水入侵区地下水中若干离子的主成分分析[J]. 海洋科学, 2004, 28(9): 6-9. Guo Dufa. Principal component analysis on the ious in the groundwater intrusion area of Laizhou Bay coast[J]. Marine Sciences, 2004, 28(9): 6-9. DOI:10.3969/j.issn.1000-3096.2004.09.002 |
| [21] |
姚菁, 于洪军, 王树昆, 等. 莱州湾海水入侵区地下水水化学特征[J]. 海洋科学, 2007, 31(4): 32-36, 41. Yao Jing, Yu Hongjun, Wang Shukun, et al. The underground water hydro-chemical characteristics of seawater invasion area around Laizhou Bay[J]. Marine Sciences, 2007, 31(4): 32-36, 41. DOI:10.3969/j.issn.1000-3096.2007.04.008 |
| [22] |
张传奇, 温小虎, 高猛, 等. 莱州湾东岸地下水化学及盐化特征[J]. 海洋通报, 2014, 33(5): 584-591. Zhang Chuanqi, Wen Xiaohu, Gao Meng, et al. Hydro-chemical characteristics and salinization characteristics of groundwater in the east coast of the Laizhou Bay[J]. Marine Science Bulletin, 2014, 33(5): 584-591. |
 2018, Vol. 42


