文章信息
- 汤博, 侯一筠, 殷玉齐, 胡珀. 2019.
- TANG Bo, HOU Yi-jun, YIN Yu-qi, HU Po. 2019.
- 利用卫星遥感海面温度、高度联合反演南海北部三维温度场
- Inversion of the three-dimensional temperature field in the northern part of the South China Sea based on the remote satellite sea surface temperature and height
- 海洋科学, 43(11): 1-10
- Marine Sciences, 43(11): 1-10.
- http://dx.doi.org/10.11759/hykx20190312002
-
文章历史
- 收稿日期:2019-03-12
- 修回日期:2019-04-10
2. 中国科学院海洋环流与波动重点实验室, 山东 青岛 266071;
3. 中国科学院大学, 北京 100049;
4. 中国科学院海洋大科学研究中心, 山东 青岛 266071;
5. 青岛海洋科学与技术试点国家实验室海洋动力过程与气候功能实验室, 山东 青岛 266237
2. Key Laboratory of Ocean Circulation and Wave, Chinese Academy of Sciences, Qingdao 266071, China;
3. University of Chinese Academy of Sciences, Beijing 100049, China;
4. Center for Ocean Mega-Science, Chinese Academy of Sciences, Qingdao 266071, China;
5. Laboratory for Ocean and Climate Dynamics, Pilot National Laboratory for Marine Science and Technology(Qingdao), Qingdao 266237, China
南海北部是北太平洋最大的边缘海区域, 最大深度超过5 000 m, 受地形、季风和黑潮入侵的影响, 温度结构多变, 存在着大量的中尺度涡旋[1-3]。该区域的涡旋主要来自于黑潮入侵过程中的流环脱落[4-6]。此外, 黑潮的斜压不稳定、风应力旋度变化以及沿岸强流的不稳定性也是导致南海涡旋生成的重要原因[7-9]。
目前, 来自Argo、CTD、XBT和海洋观测站的温度观测资料日益增多, 特别是大量的Argo观测剖面在海洋观测系统中发挥了重要作用。例如, Nan等[10]通过现场观测分析了南海北部3个长周期反气旋涡的垂直结构。胡等[11]通过巡航数据分析了一个穿越南海的非线性涡旋。然而, 现有观测资料的空间分辨率仍然较低, 且不能实时地描述海洋内部的结构和变化特征。另一方面, 卫星遥感技术的不断发展提供了完整的海面温度(SST)和海面高度(SSH)资料, 它们能够实时地监测海面信息且具有较高的空间分辨率。基于卫星观测资料得到的海面信息, 中尺度涡旋的研究成果大量涌现[12-15], 包括南海这样的涡旋活跃区域[16-18]。但通过卫星资料得到的结果仅仅停留在海表面上, 我们无法得到海表面以下的任何信息。因此, 将现场观测和卫星观测相结合是研究海洋三维结构特征及变化的重要方式。
早在20世纪80年代, Hurbburt[19]就提出了一种利用海面信息反演温度剖面的动力学方法, 他构建了一个数值海洋模型, 将模拟的高度计数据通过动态指令传递到海洋内部。随后, 众多的统计学方法相继产生[20-24], 主要包括正交函数分解法和耦合模态分析法。目前, 基于回归分析方法结合卫星观测资料和海洋内部信息的研究相对成熟[25], 回归分析法是一种基于数学统计原理的数据分析方法, 它首先对大量的统计数据进行数学处理, 通过确定因变量与某些自变量的相关关系, 建立一个相关性较强的数学函数表达式(回归方程), 并对其加以推广, 进而用于预测因变量未来可能发生的变化。利用回归分析方法, 可以建立反映海洋三维温度场和海表面SST、SSH之间数值关系的数学模型, 即经验回归模型, 进而确定变量之间是否存在相关关系, 若存在则求出其数学表达式。相较于动力学反演方法、正交函数分解法和耦合模态分析法, 回归分析法不要求历史观测资料具有时空连续性, 且计算方法更为简单且可操作性更强[25-26]。本文参考回归分析方法, 利用南海北部的历史温度剖面观测资料, 构建SST, SSH联合扩展温度剖面的经验回归模型, 然后利用卫星资料扩展了该区域的三维温度场, 并对其进行了检验。
1 数据和处理方法本文使用的历史温度剖面观测资料来自于全球海洋数据中心(National Oceanographic Data Center, NODC)提供的WOD13(World Ocean Database 2013), 主要包括高分辨率CTD, XBT, DRB, PFL, OSD和MRB等观测资料。其空间范围为110°~125°E, 15°~ 25°N, 时间范围为1993年1月1日到2018年1月1日。这些Argo站点的分布如图 1所示, 它们覆盖了整个南海北部。此外, 为了得到更有用的数据, 提高结果的准确性, 需要对原始数据进行筛选和插值, 具体步骤如下:
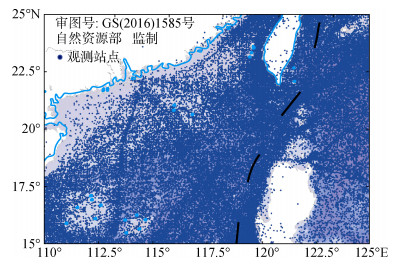 |
| 图 1 南海北部观测剖面站点的分布 Fig. 1 Distribution profiles of the observation stations in the northern part of the South China Sea |
1) 在定义的空间和时间范围内提取所需的数据, 包括温度, 盐度, 经度, 纬度, 深度和日期。
2) 删除值为NAN(Not a Number, 非数)的数据。
3) 选择温度在0~35℃, 盐度31~36的数据。
4) 删除垂直方向上数据数量少于3的观测站点。
5) 通过线性插值构建一个标准层的数据集, 垂直方向上共分为30层: 0, 5, 15, 20, 25, 30, 35, 50, 75, 100, 125, 150, 175, 200, 250, 300, 350, 400, 450, 500, 600, 700, 800, 900, 1 000, 1 100, 1 200, 1 300, 1 400, 1 500 m。虽然WOD13资料提供了非常高的垂向分辨率的数据, 但在数据筛选的过程中发现, 温度剖面在500, 600 m以下的深度变化非常不明显, 远不如500 m以上的深度。故在海表面至500 m之间, 我们一共分了20层, 基本和WOD13数据相当, 而将温度变化不明显的深层水分为10层, 这样的分层既不会影响整体的研究结果, 也在之后的回归统计分析中减少了很多的计算量。
本文用于对扩展温度场进行统计检验的温度剖面数据来自于全球海洋温盐剖面计划(GTSPP)和Argo数据集提供的温度剖面数据。GTSPP自1990年1月1日开始以来, 至2014年12月31日已累计提供了1 817.4万观测站点的温盐剖面数据集, 该数据集以XBT为主, 具有较强的时效性, 可通过NODC网站下载。Argo数据集包括全球Argo数据集和中国Argo数据集, 它们累计提供了超过140万组温度观测断面, 可通过中国Argo实时资料中心网站下载。此外, 用来自NODC的WOA13(World Ocean Atlas 2013)的气候态温度数据作为初始场, 并与反演结果进行比较。WOA13数据集提供了客观分析的标准层数据。空间分辨率为1°, 时间分辨率为月平均。该数据是平滑之后的结果, 其中涡流等中尺度信号被平滑, 因此可作为背景场检验由中尺度作用引起的温度结构异常。
本文使用的SST数据为美国远程遥感系统(RSS)提供的最优插值微波和红外波段融合的SST资料(MW_IR)。该数据结合了微波观测不受云层限制和红外观测分辨率高的优点, 融合了4个微波传感器和2个红外传感器的观测, 其中微波传感器包括热带降雨观测卫星(TRMM)搭载的微波成像仪(TMI), EOS和GOCM-W1卫星搭载的高级微波扫描辐射计(AMSR-E和AMSR-2)、WinSat微波辐射计, 而红外传感器包括Terra和Aqua卫星搭载的中等分辨率成像光谱仪(MODIS), 该资料的空间和时间分辨率分别为9 km和1 d。本文使用的卫星高度计资料(SSH)来自于AVISO分发的数据产品, 包括笛卡尔网格下的、空间分辨率为0.25°×0.25°、多卫星数据融合的日平均海表面高度异常数据。它融合了从1993年至今的Jason-1、Jason-2、Envisat RA2和HY-2高度计数据, 时间范围为1993—2018年。
目前利用海面信息反演三维温度场的回归模型主要有3种:利用SST的多项式、利用SSH的多项式, 和利用SST、SSH联合的多项式, 第三种多项式很好地结合了SST和SSH两种卫星观测资料, 并且前人的研究结果已经多次指出, 利用SST和SSH联合反演得到的海洋三维温度剖面, 优于单独利用SST或SSH反演的结果[26-28], 所以本文中直接采用了SST和SSH相结合的多项式。
首先, 每个剖面的海面动力高度可以通过其温度和盐度计算:
| $ h=\int_{0}^{H} \frac{[\nu(T, S, P)-\nu(0, 35, P)]}{\nu(0, 35, P)} \mathrm{d} z, $ | (1) |
其中ν为海水比容, ν(0, 35, P)为海水温度为0℃、盐度为35时的比容, H是海水的深度。
然后建立SST, SSH和温度剖面之间的回归关系:
| $ \begin{array}{l} {T_{i, k}}\left( {{T_{{\rm{ss}}}}, h} \right) = \overline {{T_{i, k}}} + {a_{{\rm{1}}, i, k}}\left( {{T_{{\rm{ss}}}} - \overline {{T_{i, 1}}} } \right) + {a_{{\rm{2}}, i, k}}\left( {h - \overline {{h_i}} } \right) + \\ ~~~~~~~~~~~~~~~~~~~~~~~{a_{{\rm{3}}, i, k}}\left[ {\left( {{T_{{\rm{ss}}}} - \overline {{T_{i, 1}}} } \right)\left( {h - \overline {{h_i}} } \right) - \overline {h{T_{{\rm{ss, }}i}}} } \right], \end{array} $ | (2) |
其中Ti, k(Tss, h)–
值得注意的是, 虽然我们只采用了一种结构的多项式, 但由式(2)可以看出, k表示每层的深度, 我们在每一层(30层)都根据足量的历史观测温度剖面数据确定了该层的回归系数, 它们在每层中是不同的, 取决于该层的历史温度剖面资料, 所以由式(2)扩展得到的温度场在垂向上的每一层都是相对独立的, 都能较好地反映出实际温度剖面的变化特征。
2 结果与讨论 2.1 海洋三维温度静态气候场构建为了能够利用海洋卫星遥感数据对水下的三维温度和盐度进行时空扩展, 需要首先建立水下三维温度的基本态, 即静态温度气候场。
以WOA13温度数据作为初始场, 采用最优插值数据同化技术, 同化预处理后的历史温度剖面观测资料(WOD13), 形成不同水深层次、各网格点上的温度静态气候场产品。
方程(3)表示利用最优差值法, 形成每个格点位置i, 深度上第k层的气候态温度数据TC, i, k。
| $ {T_{{\rm{C}}, i, k}} = {T_{{\rm{B}}, i, k}} + \sum\limits_{j = 1}^N {{w_{i, j}}\left( {{T_{{\rm{0}}, i, k}} - {T_{{\rm{B}}, i, k}}} \right)} , $ | (3) |
其中, T0, i, k为位置j处的历史温度观测数据, TB, i, k为插值位置的气候学温度, N为格点位置i附近的观测点个数。权重系数wi, j通过下面的方程求得:
| $ {{\boldsymbol{C}}_i}{{\boldsymbol{W}}_i} = {{\boldsymbol{F}}_i}, $ | (4) |
其中, wi, j为矩阵Wi的元素, cm, n为矩阵Ci的元素, 并且为初始猜测温度的误差协方差cfg, m, n与不同观测位置观测误差rm和rn的协方差c0, m, n之和, Fi为网格点与观测点之间的初始猜测误差协方差矩阵。得到的温度静态气候场为水平分辨率为0.25°的月平均数据。
利用建立的南海北部静态气候场数据, 将温度剖面取水平平均, 得到温度剖面的垂直分布图, 将其与相同海区的WOA13各月的垂向温度剖面结果进行比较(图 2)。可以看出, 与WOA13的结果相比, 获得的温度曲线略有变化: 600 m以下深度的温度高于WOA13, 约0.3℃; 在600 m以上的深度, 静态气候场各月的温度与WOA13接近。图 3显示了温度分布的标准偏差的垂直分布。它们的值相对接近, 并且在温跃层附近达到最大值, 约1.8℃。此外, 随着水深的增加, 温度的标准偏差逐渐减小, 当水深超过1 000 m时, 温度的标准偏差接近最小值约0.2℃。
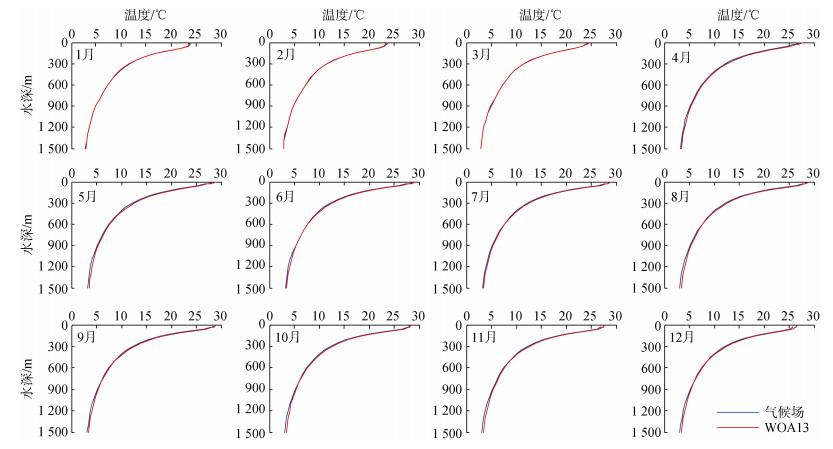 |
| 图 2 南海北部月平均气温剖面图 Fig. 2 Monthly temperature profiles in the northern part of the South China Sea |
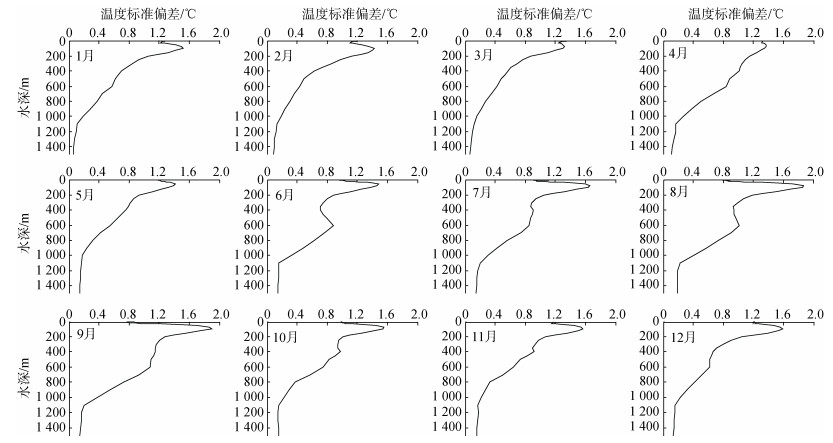 |
| 图 3 南海北部静态气候温度场各月标准偏差的垂直分布 Fig. 3 Vertical distribution of the monthly standard deviation of the static climatetemperature field in the northern part of the South China Sea |
根据方程(2), 利用SST和SSH数据集, 将得到的温度静态气候场扩展为空间分辨率为0.25°, 时间分辨率是1 d的三维动态温度场。随后, 对近20年来GTSPP数据集和Argo数据集中的温度剖面观测数据经过筛选和质量控制, 整理为用于统计检验的观测数据集。
2.2.1 温度扩展场的统计检验将扩展得到的三维温度场数据插值到每个观测位置上得到相应的扩展温度结果, 并且逐月计算扩展结果和观测结果之间的误差, 其垂向分布如图 4所示, 表 1为垂直方向上每层的误差数值。结果表明, 温跃层附近(50~100 m)的误差较大, 普遍超过1℃; 在温跃层以下, 随着深度的增加, 误差急剧减少; 在7月份75 m水深处, 误差达到最大值1.55℃。
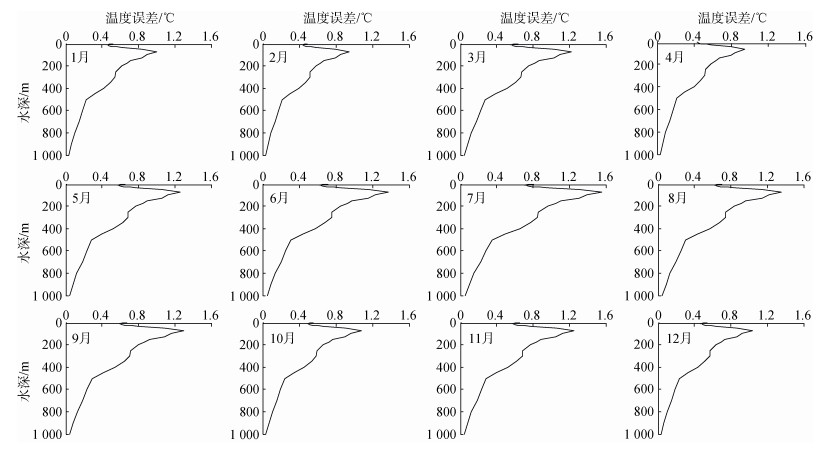 |
| 图 4 南海北部扩展温度场各月误差的垂向分布 Fig. 4 Vertical distribution of monthly errors of the expanded temperature field in the northern part of the South China Sea |
| 深度/m | 温度剖面各月误差/℃ | |||||||||||
| 1月 | 2月 | 3月 | 4月 | 5月 | 6月 | 7月 | 8月 | 9月 | 10月 | 11月 | 12月 | |
| 0 | 0.52 | 0.49 | 0.64 | 0.49 | 0.65 | 0.72 | 0.81 | 0.71 | 0.67 | 0.56 | 0.65 | 0.54 |
| 5 | 0.48 | 0.46 | 0.59 | 0.45 | 0.61 | 0.66 | 0.75 | 0.66 | 0.63 | 0.52 | 0.60 | 0.50 |
| 10 | 0.45 | 0.43 | 0.55 | 0.43 | 0.57 | 0.62 | 0.70 | 0.62 | 0.59 | 0.49 | 0.57 | 0.47 |
| 15 | 0.46 | 0.44 | 0.57 | 0.44 | 0.58 | 0.64 | 0.72 | 0.63 | 0.60 | 0.50 | 0.58 | 0.48 |
| 20 | 0.48 | 0.45 | 0.58 | 0.45 | 0.60 | 0.66 | 0.74 | 0.65 | 0.62 | 0.51 | 0.60 | 0.49 |
| 25 | 0.51 | 0.48 | 0.62 | 0.48 | 0.64 | 0.70 | 0.79 | 0.69 | 0.66 | 0.55 | 0.63 | 0.52 |
| 30 | 0.56 | 0.53 | 0.69 | 0.53 | 0.70 | 0.77 | 0.87 | 0.76 | 0.73 | 0.60 | 0.70 | 0.58 |
| 35 | 0.61 | 0.58 | 0.75 | 0.58 | 0.77 | 0.85 | 0.95 | 0.84 | 0.80 | 0.66 | 0.77 | 0.64 |
| 50 | 0.84 | 0.80 | 1.03 | 0.79 | 1.06 | 1.16 | 1.31 | 1.14 | 1.09 | 0.91 | 1.05 | 0.87 |
| 75 | 1.00 | 0.95 | 1.22 | 0.94 | 1.26 | 1.38 | 1.55 | 1.36 | 1.30 | 1.08 | 1.25 | 1.04 |
| 100 | 0.89 | 0.85 | 1.10 | 0.84 | 1.12 | 1.23 | 1.39 | 1.22 | 1.16 | 0.96 | 1.12 | 0.93 |
| 125 | 0.84 | 0.80 | 1.03 | 0.79 | 1.05 | 1.16 | 1.30 | 1.14 | 1.09 | 0.90 | 1.05 | 0.87 |
| 150 | 0.71 | 0.67 | 0.87 | 0.67 | 0.89 | 0.98 | 1.10 | 0.97 | 0.92 | 0.77 | 0.89 | 0.74 |
| 175 | 0.67 | 0.64 | 0.82 | 0.63 | 0.84 | 0.93 | 1.05 | 0.91 | 0.87 | 0.72 | 0.84 | 0.70 |
| 200 | 0.62 | 0.59 | 0.76 | 0.58 | 0.78 | 0.85 | 0.96 | 0.84 | 0.80 | 0.67 | 0.77 | 0.64 |
| 250 | 0.55 | 0.52 | 0.67 | 0.52 | 0.69 | 0.76 | 0.85 | 0.75 | 0.71 | 0.59 | 0.69 | 0.57 |
| 300 | 0.55 | 0.52 | 0.67 | 0.52 | 0.69 | 0.75 | 0.85 | 0.74 | 0.71 | 0.59 | 0.68 | 0.57 |
| 350 | 0.50 | 0.47 | 0.61 | 0.47 | 0.62 | 0.68 | 0.77 | 0.67 | 0.64 | 0.53 | 0.62 | 0.51 |
| 400 | 0.42 | 0.40 | 0.51 | 0.40 | 0.53 | 0.58 | 0.65 | 0.57 | 0.54 | 0.45 | 0.53 | 0.43 |
| 450 | 0.32 | 0.30 | 0.39 | 0.30 | 0.40 | 0.44 | 0.50 | 0.43 | 0.41 | 0.34 | 0.40 | 0.33 |
| 500 | 0.22 | 0.21 | 0.27 | 0.21 | 0.28 | 0.31 | 0.35 | 0.31 | 0.29 | 0.24 | 0.28 | 0.23 |
| 600 | 0.18 | 0.17 | 0.23 | 0.17 | 0.23 | 0.25 | 0.29 | 0.25 | 0.24 | 0.20 | 0.23 | 0.19 |
| 700 | 0.15 | 0.14 | 0.18 | 0.14 | 0.19 | 0.20 | 0.23 | 0.20 | 0.19 | 0.16 | 0.19 | 0.15 |
| 800 | 0.10 | 0.09 | 0.12 | 0.09 | 0.12 | 0.14 | 0.15 | 0.13 | 0.13 | 0.11 | 0.12 | 0.10 |
| 900 | 0.06 | 0.06 | 0.08 | 0.06 | 0.08 | 0.09 | 0.10 | 0.09 | 0.08 | 0.07 | 0.08 | 0.07 |
| 1 000 | 0.03 | 0.03 | 0.04 | 0.03 | 0.04 | 0.05 | 0.05 | 0.05 | 0.05 | 0.04 | 0.04 | 0.04 |
在图 5中选择了站点20110303和20110822。将扩展的温度曲线与图 6中的观察数据进行比较。结果表明, 扩展剖面非常接近实际观测剖面, 误差小于1℃, 证明扩展场是有效的, 可以应用于该区域。
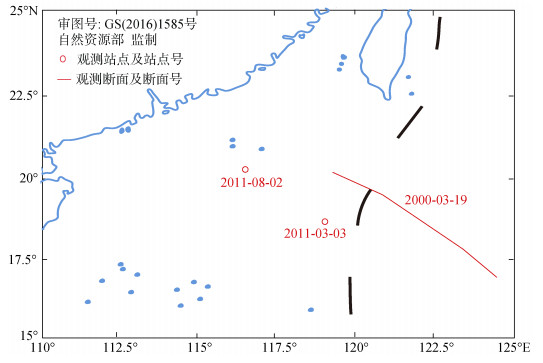 |
| 图 5 两个观察站和一个温度断面 Fig. 5 Two observation stations and a temperature cross section |
 |
| 图 6 南海北部两个观测站的温度剖面 Fig. 6 Temperature profiles of two observation stations in the northern part of the South China Sea |
选择台湾岛和吕宋岛之间的观测断面来检验扩展结果。部分的位置如图 7所示。观测断面的起始位置是(118.0°E, 21.5°N), 最终位置是(124.0°E, 16.5°N), 观测时间是2000年3月19日。从观测到的温度剖面(图 7a)可以看出, 该观测断面附近存在一个较强气旋涡的特征, 导致等温线在122.0°E附近向上凸起; 而在120.8°E和123.3°E附近等温线下沉, 该位置有反气旋涡的特征。相较于3月的WOA13气候态温度剖面(图 7c), 扩展得到的温度剖面(图 7b)能更好地反映海洋内部温度结构的变化特征, 且观测断面的中尺度特征也得到了清晰的体现。
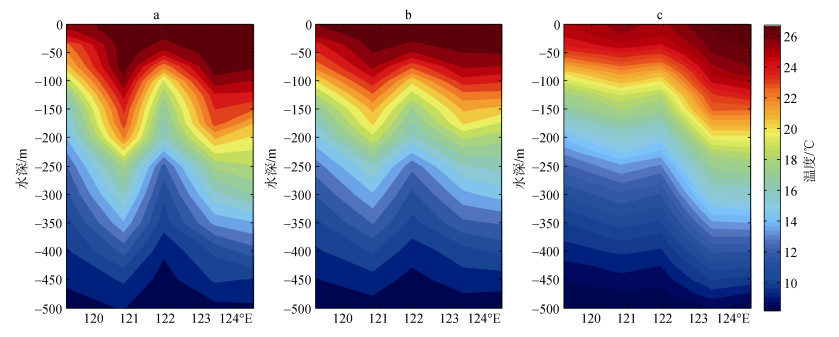 |
| 图 7 断面2000-03-19基于不同资料的温度剖面 Fig. 7 Temperature profiles of the cross section 2000-03-19 based on the observations 注: a: 2000年3月19日实测温度断面; b: 2000年3月19日扩展温度场模拟的温度断面; c: 3月WOA13温度断面 |
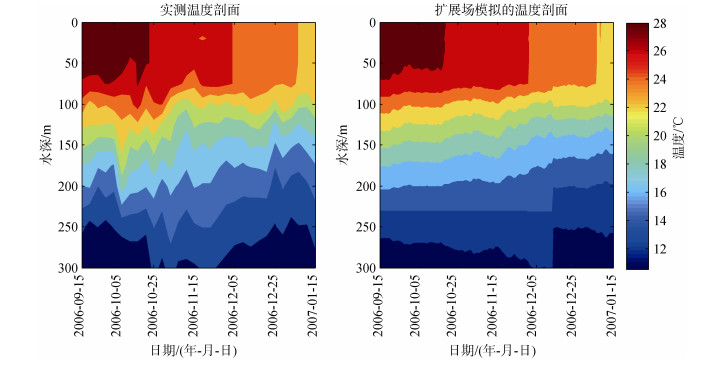
吕宋暖涡LWE(Luzon Warm Eddy)是南海北部靠近吕宋海峡附近的一个季节性反气旋涡, 其中心位于约117.5°E, 21°N[29]。袁[30]等使用高度计数据来分析该涡旋的特征, 并将其命名为“吕宋暖涡(LWE)”。图 8为吕宋暖涡期间SLA(sea level anomaly, 海面高度距平)的变化, 黑色方框为观测区域, 不难看出, 在2006年9月15日至2006年11月5日期间吕宋海峡西侧(观测区域)具有较高的SLA, 反气旋涡逐渐成形。随后涡旋逐渐向西移动, 观测区域内SLA也随之降低。
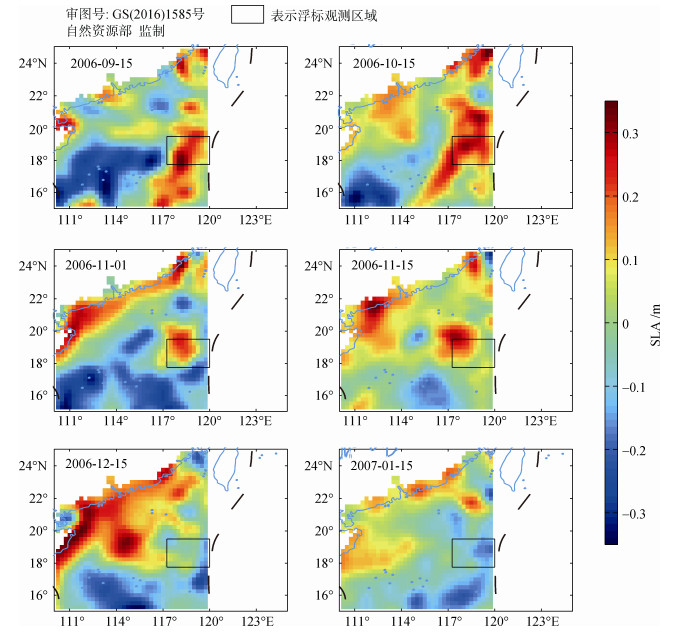 |
| 图 8 2006年9月15日至2007年1月15日吕宋海峡西侧的SLA分布 Fig. 8 SLA (colors) from September 15, 2006 to January 15, 2007 of the western part of the Luzon Strait |
图 9分别展示了基于观测数据和扩展温度场的观测区域(图 8)中温度分布的时间序列。观测区域的温度剖面数据来自于中国Argo计划中的浮标2900391, 与观测数据类似, 扩展温度场的结果清楚地反映出了观测区域在吕宋暖涡过程中温度的结构及变化特征。由于受到吕宋暖涡的影响, 2006年11月之前, 海洋上层温度高达28℃, 温跃层深度超过150 m。随着吕宋暖涡的逐渐离开、消失, 观测区域的温跃层逐渐上升至120 m以上, 上层海洋温度也逐渐降低至22℃。
海洋内部温度信息是海洋学研究的基本内容, 对描述海水性质方面起着至关重要的作用, 而卫星资料与观测资料的结合则是全面分析海洋内部结构特征的重要手段。本文首先对历史Argo剖面观测资料(WOD13)进行了筛选和插值, 建立了南海北部的静态气候温度场, 描述了它们的月垂直分布。结果表明, 所获得的温度曲线与WOA13的结果相似, 且它们的标准偏差相对接近, 在温跃层附近较大。随后, 通过线性回归分析方法建立由海面信息反演海洋内部三维温度场的经验回归模型。利用卫星遥感SST和SSH数据集构建了南海北部空间分辨率为0.25°、时间分辨率为1 d的三维温度场, 并用最近30年的温度观测数据进行了检验。结果表明, 扩展温度剖面的月误差普遍小于1.0℃, 在温跃层附近略大, 最大达到1.55℃。单个观测站点的扩展温度剖面同样与实际观测结果相近。此外, 通过与实测资料的对比分析, 扩展得到的三维温度场能够清晰地反映海洋断面温度场的垂直结构和其内部的中尺度特征, 并且准确地模拟了某一观测区域(图 8)在吕宋暖涡过程中三维温度场的结构变化特征。
综上所述, 本文得到的扩展三维温度场具有较低的月平均误差, 它既能较为真实地反映海洋的垂直结构和内部变化特征, 又能展示海洋内中尺度过程。该扩展场可以作为海洋数值模型的初始场, 有效结合观测数据和卫星数据, 更加准确地分析南海北部温度的三维结构及变化特征。在今后的研究中, 我们将进一步改进回归模型并通过同化技术等手段提高反演精度。
| [1] |
Wang G H, Su J L, Chu P C. Mesoscale eddies in the South China Sea observed with altimeter data[J]. Geophysical Research Letters, 2003, 30(21): 2121. DOI:10.1029/2003GL018532 |
| [2] |
林鹏飞, 王凡, 陈永利, 等. 南海中尺度涡的时空变化规律Ⅰ统计特征分析[J]. 海洋学报, 2007, 29(3): 14-22. Lin Pengfei, Wang Fan, Chen Yongli, et al. Temporal and spatial variation characteristics on eddies in the South China Sea Ⅰ. Statistical analyses[J]. Acta Oceanologica Sinica, 2007, 29(3): 14-22. DOI:10.3321/j.issn:0253-4193.2007.03.002 |
| [3] |
Chaigneau A, Texier M L, Eldin G, et al. Vertical structure of mesoscale eddies in the eastern South Pacific Ocean:A composite analysis from altimetry and Argo profiling floats[J]. Journal of Geophysical Research, 2011, 116: C11025. DOI:10.1029/2011JC007134 |
| [4] |
李立. 南海中尺度海洋现象研究概述[J]. 台湾海峡, 2002, 21(2): 265-273. Li Li. A review on mesoscale oceanographical phenomena in the South China Sea[J]. Journal of Oceanography in Taiwan Strait, 2002, 21(2): 265-273. DOI:10.3969/j.issn.1000-8160.2002.02.021 |
| [5] |
Wang L, Koblinsky C, Howden S. Mesoscale variability in the South China Sea from the TOPEX/Poseidon altimetry data[J]. Deep-Sea Research Part Ⅰ, 2000, 47(4): 681-708. DOI:10.1016/S0967-0637(99)00068-0 |
| [6] |
Hu J, Zheng Q, Sun Z, et al. Penetration of nonlinear Rossby eddies into South China Sea evidenced by cruise data[J]. Journal of Geophysical Research-Oceans, 2012, 117: C03010. DOI:10.1029/2011JC007525 |
| [7] |
Yang H, Liu Q. Forced Rossby Wave in the Northern South China Sea[J]. Deep-Sea Research Part Ⅰ, 2003, 50: 917-926. DOI:10.1016/S0967-0637(03)00074-8 |
| [8] |
Gan J, Qu T. Coastal jet separation and associated flow variability in the southwest South China Sea[J]. DeepSea Research Part Ⅰ, 2008, 55(1): 1-19. |
| [9] |
Nan F, He Z, Zhou H, et al. Three long-lived anticyclonic eddies in the northern South China Sea[J]. Journal of Geophysical Research-Oceans, 2011, 116: C5. DOI:10.1029/2010JC006790 |
| [10] |
Chelton D B, Schlax M G, Samelson R M. Global observations of nonlinear mesoscale eddies[J]. Progress in Oceanography, 2011, 91(2): 167-216. |
| [11] |
Chaigneau A, Eldin G, Dewitte B. Eddy activity in the four major upwelling systems from satellite altimetry (1992-2007)[J]. Progress in Oceanography, 2009, 83(1): 117-123. |
| [12] |
Li Q Y, Sun L, Liu S S, et al. A new mononuclear eddy identification method with simple splitting strategies[J]. Remote Sensing Letters, 2014, 5(1): 65-72. |
| [13] |
Li Q Y, Sun L, Lin S F. GEM:a dynamic tracking model for mesoscale eddies in the ocean[J]. Ocean Science, 2016, 12(6): 1249-1267. DOI:10.5194/os-12-1249-2016 |
| [14] |
Chen G, Hou Y, Chu X. Mesoscale eddies in the South China Sea:Mean properties, spatiotemporal variability, and impact on thermohaline structure[J]. Journal of Geophysical Research-Oceans, 2011, 116: C06018. DOI:10.1029/2010JC006716 |
| [15] |
Chen G, Gan J, Xie Q, et al. Eddy heat and salt transports in the South China Sea and their seasonal modulations[J]. Journal of Geophysical Research-Oceans, 2012, 117: C05021. DOI:10.1029/2011JC007724 |
| [16] |
Hu J, Gan J, Sun Z, et al. Observed three-dimensional structure of a cold eddy in the southwestern South China Sea[J]. Journal of Geophysical Research-Oceans, 2011, 116: C05016. DOI:10.1029/2010JC006810 |
| [17] |
Hurlburt H E. Dynamic transfer of simulated altimeter data into subsurface information by a numerical ocean model[J]. Journal of Geophysical Research Atmospheres, 1986, 91(C2): 2372-2400. DOI:10.1029/JC091iC02p02372 |
| [18] |
Hurlbtrt H E, Fox D N, Metzger J. Statistical inference of weekly correlated subthermocline fields from satellite altimeter data[J]. Journal of Geophysical Research Atmospheres, 1990, 95(C7): 11375-11409. DOI:10.1029/JC095iC07p11375 |
| [19] |
Carnes M R, Mitchell J L, Dewitt P W. Synthetic temperature profiles derived from Geosat altimetry:Comparison with air-dropped expendable bathythermograph profiles[J]. Journal of Geophysical Research Atmospheres, 1990, 95(C10): 17979-17992. DOI:10.1029/JC095iC10p17979 |
| [20] |
Carnes M R, Teague W J, Mitchell J L. Inference of subsurface thermohlaline structure from fields measurable by satellite[J]. Journal of Atmospheric Oceanic Technology, 1994, 11: 551-566. DOI:10.1175/1520-0426(1994)011<0551:IOSTSF>2.0.CO;2 |
| [21] |
Gavart M, Mey P. Isopycnal EOFs in the Azores Current region:A statistical tool for dynamical analysis and data assimilation[J]. Journal of Physical Oceanography, 1997, 27: 2146-2157. DOI:10.1175/1520-0485(0)027<2146:IEITAC>2.0.CO;2 |
| [22] |
Pascual A, Gomis D. Use of surface data to estimate geostrophic transport[J]. Journal of Atmospheric Oceanic Technology, 2003, 20: 912-926. DOI:10.1175/1520-0426(2003)020<0912:UOSDTE>2.0.CO;2 |
| [23] |
Fox D N, Teague W J, Berron C N, et al. The modular ocean data assimilation system[J]. Journal of Atmospheric Oceanic Technology, 2002, 19: 240-252. DOI:10.1175/1520-0426(2002)019<0240:TMODAS>2.0.CO;2 |
| [24] |
王喜东, 韩桂军, 李威, 等. 利用卫星观测海面信息反演三维温度场[J]. 热带海洋学报, 2011, 30(6): 10-17. Wang Xidong, Han Guijun, Li Wei, et al. Reconstruction of ocean temperature profile using satellite observations[J]. Journal of Tropical Oceanography, 2011, 30(6): 10-17. DOI:10.3969/j.issn.1009-5470.2011.06.002 |
| [25] |
Guinehut S, Traon P-Yle, Larnicol G, et al. Combining Argo and remote-sensing data to estimate the ocean three dimensional temperature fields:A first approach based on simulated observations[J]. Journal of Marine Systems, 2004, 46(1-4): 85-98. DOI:10.1016/j.jmarsys.2003.11.022 |
| [26] |
张春玲, 许建平, 鲍献文, 等. 利用遥感SST反演上层海洋三维温度场[J]. 海洋与湖沼, 2014, 45(1): 115-125. Zhang Chunling, Xu Jianping, Bao Xianwen, et al. Inversion of subsurface three-dimensional temperature from remote satellite sea surface temperature[J]. Oceanoloigia et Limnologia Sinica, 2014, 45(1): 115-125. |
| [27] |
Li L, Pohlmann T. The South China Sea warm-core ring 94S and its influence on the distribution of chemical tracers[J]. Ocean Dynamics, 2002, 52(3): 116-122. DOI:10.1007/s10236-001-0009-9 |
| [28] |
Yuan D L, Han W Q, Hu D X. Anti-cyclonic eddies northwest of Luzon in summer-fall observed by satellite altimeters[J]. Geophysical Research Letters, 2007, 34: L13610. DOI:10.1029/2007GLo29401 |
 2019, Vol. 43


