文章信息
- 高超, 查芊郁, 阮甜, 杨茹. 2019.
- GAO Chao, ZHA Qian-yu, RUAN Tian, YANG Ru. 2019.
- 海平面上升研究进展的文献分析
- Bibliometric analysis of global research progress on sea level rise
- 海洋科学, 43(2): 97-107
- Marine Sciences, 43(2): 97-107.
- http://dx.doi.org/10.11759/hykx20180324001
-
文章历史
- 收稿日期:2018-03-24
- 修回日期:2018-05-09
2. 安徽师范大学地理与旅游学院, 安徽 芜湖 241000
2. College of Geography and Tourism, Anhui Normal University, Wuhu 241000, China
进入21世纪以来, 气候变暖为毋庸置疑的事实。气候变暖导致诸多灾害事件发生, 海平面上升为其中之一[1]。有研究表明中国海平面上升速率已达0.593 cm/a[2]。海平面上升会引发风暴潮、海岸侵蚀等[3]众多海洋及海岸带灾害。越来越多关于海平面上升的文献发表, 包括全球海平面变化特征[4], 加速海平面上升的因素[5-7]及对海平面变化产生的影响[8], 海平面上升引起的事件[9-10]等。但相关研究文献类型众多, 研究侧重点各不相同, 研究趋势未经系统归纳, 相似的研究也不少, 缺乏关于海平面上升现有文献的总体认识。
考虑到已出版的众多关于海平面上升的研究文献, 文献分析法可以综合鉴别、整理, 并对其进行系统性地分析来获取信息, 从而对该类型文献形成科学认识[11]。其在经济学[12]、生物学[13]、医学[14]等众多领域及国内外地区[15-16]得到成功应用。目前, 全球最大, 覆盖学科最多的数据库为ISI Web of Science(institute for scientific information, ISI)数据库, 收录超过10 000种高影响期刊, 所涵盖学科包括自然科学、社会科学、艺术学等众多领域[17]。有学者成功运用基于Web of Science数据库研究其国家, 机构, 期刊, 学科种类等分析该领域的发展状况[18]。关于某领域文献的发文量的变化, 文献引用期刊数, 国家或机构间合作等更进一步的研究则可做进一步深入研究。
由此, 本研究基于ISI Web of Science核心合集1993—2016年数据库, 以“海平面上升”为关键词, 搜索已出版文献。对过去研究发展, 目前研究现状, 主要发文国家、单位, 发表期刊、研究热点等进行分析, 针对类似问题的讨论, 希望通过对文献的梳理为后续的研究提供指引及借鉴的依据。同时, 通过对文献分析法的运用, 能够使研究者能更有针对性地运用该方法到相关学术领域。
1 数据和方法 1.1 研究数据2017年10月23日在Web of Science核心合集数据库中以“sea level rise”or “sea-level rise”or“sea level rising”or“sea-level rising”为关键词, 1993— 2016年出版的文献中搜索到的数据全记录及引用参考文献。提取作者名, 文献标题, 语言等共12项内容进行分析。重新整理并删除重复与空白记录后, 共9 358篇文献。
共16种文献类型, 其中最多的为Article(8 050篇), 占文献总数的86.02%。文献出版语言共11种, 其中以英文出版(9248篇)占文献总数的98.8%。英语发文量占比如此高, 与SCI数据库收录大部分英文期刊有关。除英文外还有其他出版语言及发文量(篇):法语(53), 西班牙语(18), 中文(15), 德语(9), 俄语(8), 意大利语(2), 葡萄牙语(2), 克罗地亚语(1), 韩语(1)。
在处理数据的过程中, 将作者地址中Hongkong, Macao, Taiwan并入中国; England, Scotland, Northern Ireland, 以及Wales并入英国, Fr Polynesia, Guadeloupe, French Guiana等法属地并入法国。“单一国家出版”表示文献所有作者来自同一国家, “国际合作出版”表示文献所有作者来自两个及以上不同国家[19]; 同理, “单一机构出版”表示文献所有作者来自同一单位, “多机构合作出版”表示文献所有作者来自两个或两个以上不同单位[20]。
1.2 研究方法本研究采用bibexcel软件提取分析从Web of Science网站中下载数据, 并用PC-ORD4软件对关键词等提取的类型进行聚类分析。把相似的对象通过静态分类的方法分成不同的组别或者更多的子集, 这样让在同一个子集中的成员对象都有相似的一些属性。主要对提出的关键词(DE)进行聚类分析, 目的是为了划分出不同时间段, 分析研究热点的变化及未来趋势。本研究中聚类分析所采用的公式: Distance Measure为Sorensen(Bray-Curtis), Group Linkage Method为Ward’s Method。
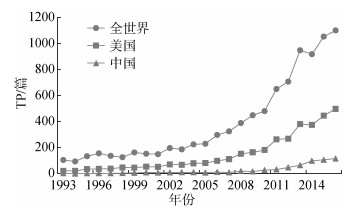
2 结果分析 2.1 整体发文变化趋势整理数据发现关于“海平面上升”文献最早出版年份为1993年。统计1993—2016年文献发文量(TP)、页数(PG)、被引频次(TC)、作者人数(AU)、引用次数(NR)等内容如表 1。随着时间的变化, 平均每篇文献的页数(PG/TP)无明显变化趋势, 均在13~15页; 平均每篇文献的被引频次(TC/TP)总体先呈上升趋势, 2002年达到顶峰, 而后呈较大幅降低趋势, 总体看来年份越久的文献被引频次越高; 而平均每篇文献的作者数(AU/TP)从1993年2.4个到2016年增至4.9个, 表明越来越多文献由多名作者合作完成; 平均每篇文献的引用文献数(NR/TP)呈上升趋势, 众多学者随着研究的不断深入开始越来越注重对于其他学者观点的引用, 文献的内容渐趋全面客观。统计1993—2016年全世界海平面上升发文量(图 1)。总发文量逐年增加, 尤其是2010年后增幅明显, 从480篇增至1101篇。发文量的不断增长可能受以下两方面因素的影响:一方面, 海平面上升已成为全球重要的环境问题, 越来越受到社会各界的高度重视, 伴随海洋灾害的危害程度不断加大, 各沿海国家关于海平面变化研究的需求也愈加紧迫; 另一方面, 科学技术的进步带来更为便捷的探测手段, 极大丰富了研究成果。如卫星高程监测技术的出现, 作为一种全新的高效观测手段, 弥补了传统验潮站存在的地域局限, 使进行数据采集的地区得到了极大的扩展, 众多更规范连续的数据填补了以往研究的空白。
| 年份 | TP/篇 | PG/页 | (PG/TP)/(页/篇) | TC/次 | (TC/TP)/(次/篇) | AU/人 | (AU/TP)/(人/篇) | NR/次 | (NR/TP)/(次/篇) |
| 1993 | 104 | 1 549 | 14.9 | 4 726 | 45.4 | 251 | 2.4 | 4 496 | 43.2 |
| 1994 | 93 | 1 312 | 14.1 | 3 638 | 39.1 | 209 | 2.2 | 3 845 | 41.3 |
| 1995 | 133 | 1 954 | 14.7 | 5 153 | 38.7 | 344 | 2.6 | 6 524 | 49.1 |
| 1996 | 155 | 2 325 | 15.0 | 5 625 | 36.3 | 414 | 2.7 | 7 355 | 47.5 |
| 1997 | 136 | 2 175 | 16.0 | 6 993 | 51.4 | 337 | 2.5 | 6 840 | 50.3 |
| 1998 | 125 | 1 857 | 14.9 | 5 471 | 43.8 | 372 | 3.0 | 6 147 | 49.2 |
| 1999 | 162 | 2 464 | 15.2 | 7 566 | 46.7 | 482 | 3.0 | 7 720 | 47.7 |
| 2000 | 152 | 2 448 | 16.1 | 6 812 | 44.8 | 482 | 3.2 | 8 920 | 58.7 |
| 2001 | 149 | 2 309 | 15.5 | 6 733 | 45.2 | 430 | 2.9 | 8 273 | 55.5 |
| 2002 | 196 | 3 085 | 15.7 | 11 522 | 58.8 | 640 | 3.3 | 11 066 | 56.5 |
| 2003 | 186 | 2 954 | 15.9 | 8 849 | 47.6 | 654 | 3.5 | 9 848 | 52.9 |
| 2004 | 224 | 3 447 | 15.4 | 10 035 | 44.8 | 780 | 3.5 | 12 028 | 53.7 |
| 2005 | 229 | 3 352 | 14.6 | 10 422 | 45.5 | 833 | 3.6 | 11 609 | 50.7 |
| 2006 | 297 | 4 450 | 15.0 | 14 712 | 49.5 | 1 090 | 3.7 | 15 776 | 53.1 |
| 2007 | 324 | 4 424 | 13.7 | 11 684 | 36.1 | 1 204 | 3.7 | 15 985 | 49.3 |
| 2008 | 388 | 5 297 | 13.7 | 15 085 | 38.9 | 1 460 | 3.8 | 21 362 | 55.1 |
| 2009 | 448 | 5 891 | 13.1 | 19 490 | 43.5 | 1 844 | 4.1 | 25 561 | 57.1 |
| 2010 | 480 | 6 343 | 13.2 | 14 534 | 30.3 | 1 843 | 3.8 | 27 626 | 57.6 |
| 2011 | 650 | 9 091 | 14.0 | 16 933 | 26.1 | 2 702 | 4.2 | 38 336 | 59.0 |
| 2012 | 707 | 9 466 | 13.4 | 16 076 | 22.7 | 2 814 | 4.0 | 43 028 | 60.9 |
| 2013 | 948 | 12 016 | 12.7 | 16 332 | 17.2 | 4 144 | 4.4 | 55 386 | 58.4 |
| 2014 | 918 | 12 352 | 13.5 | 10 770 | 11.7 | 4 369 | 4.8 | 56 848 | 61.9 |
| 2015 | 1 053 | 15 375 | 14.6 | 7 391 | 7.0 | 4 833 | 4.6 | 68 599 | 65.1 |
| 2016 | 1 101 | 15 366 | 14.0 | 3 362 | 3.1 | 5 386 | 4.9 | 70 533 | 64.1 |
| 平均 | 14.5 | 36.4 | 3.5 | 54 |
 |
| 图 1 “海平面上升”文献发文量变化图 Fig. 1 The change in "sea level rise" publications |
美国发文量变化趋势与全世界相同, 发文量约占全世界发文总量的50%, 但2013年以后上升速率不及世界范围, 因为此时随着其他国家纷纷投入“海平面上升”的研究, 全世界发文量得到了大幅增长, 其中以中国最为明显, 中国自1993—2008年发文量始终处于较低水平, 自2008年开始逐渐增加, 至2013年后发文量开始大幅增加。
2.2 主要发文国家、机构及合作关系 2.2.1 主要发文国家、机构共140个国家和5 363个机构参与“海平面上升”相关文献的出版。发文量前20的国家和机构如表 2、表 3。其中包括国家/机构TP、独立完成文献量(STP)以及合作完成文献量(ITP); 国家发文量占总文献数比例(tp(%))、独立发文量占该国/机构总文献数的比例(stp(%))、合作发文量占该国\机构总文献数的比例(ttp(%); 国家/机构TC、独立完成文献被引频次(STC)以及合作完成文献被引频次(ITC)。
| 国家 | TP/篇 | tp/% | TC/次 | (TC/TP)/(次/篇) | ||||||||||
| TP | STP | ITP | TP | STP | ITP | TC | STC | ITC | STC/STP | ITC/ITP | ||||
| 美国 | 3 572 | 2 229 | 1 343 | 25.72 | 62.4 | 37.6 | 112 511 | 64 796 | 47 715 | 29.1 | 35.5 | |||
| 英国 | 1 458 | 547 | 911 | 10.5 | 37.5 | 62.5 | 49 518 | 15 425 | 34 093 | 28.2 | 37.4 | |||
| 澳大利亚 | 859 | 397 | 462 | 6.19 | 46.2 | 53.8 | 28 127 | 10 046 | 18 081 | 25.3 | 39.1 | |||
| 德国 | 818 | 256 | 562 | 5.89 | 31.3 | 68.7 | 24 816 | 5 413 | 19 403 | 21.1 | 34.5 | |||
| 法国 | 696 | 249 | 447 | 5.01 | 35.8 | 64.2 | 20 693 | 5 823 | 14 870 | 23.4 | 33.3 | |||
| 荷兰 | 622 | 208 | 414 | 4.48 | 33.4 | 66.6 | 21 270 | 6 227 | 15 043 | 29.9 | 36.3 | |||
| 中国 | 600 | 245 | 355 | 4.32 | 40.8 | 59.2 | 9 747 | 2 541 | 7 206 | 10.4 | 20.3 | |||
| 加拿大 | 575 | 228 | 347 | 4.14 | 39.7 | 60.3 | 19 434 | 5 302 | 14 132 | 23.3 | 40.7 | |||
| 意大利 | 448 | 198 | 250 | 3.23 | 44.2 | 55.8 | 11 304 | 3 741 | 7 563 | 18.9 | 30.3 | |||
| 西班牙 | 355 | 99 | 256 | 2.56 | 27.9 | 72.1 | 8 245 | 1 468 | 6 777 | 14.8 | 26.5 | |||
| 日本 | 294 | 123 | 171 | 2.12 | 41.8 | 58.2 | 8 415 | 1 841 | 6 574 | 15.0 | 38.4 | |||
| 丹麦 | 223 | 65 | 158 | 1.61 | 29.1 | 70.9 | 6 269 | 1 155 | 5 114 | 17.8 | 32.4 | |||
| 瑞士 | 219 | 47 | 172 | 1.58 | 21.5 | 78.5 | 8 697 | 1 602 | 7 095 | 34.1 | 41.3 | |||
| 挪威 | 190 | 37 | 153 | 1.37 | 19.5 | 80.5 | 6 693 | 923 | 5 770 | 24.9 | 37.7 | |||
| 比利时 | 182 | 35 | 147 | 1.31 | 19.2 | 80.8 | 6 363 | 916 | 5 447 | 26.2 | 37.1 | |||
| 印度 | 182 | 121 | 61 | 1.31 | 66.5 | 33.5 | 3 638 | 1 404 | 2 234 | 11.6 | 36.6 | |||
| 新西兰 | 170 | 58 | 112 | 1.22 | 34.1 | 65.9 | 5 312 | 1 119 | 4 193 | 19.3 | 37.4 | |||
| 葡萄牙 | 165 | 64 | 101 | 1.19 | 38.8 | 61.2 | 2 424 | 939 | 1 485 | 14.7 | 14.7 | |||
| 瑞典 | 159 | 28 | 131 | 1.14 | 17.6 | 82.4 | 6 064 | 511 | 5 553 | 18.3 | 42.4 | |||
| 俄罗斯 | 124 | 51 | 73 | 0.89 | 41.1 | 58.9 | 3 168 | 334 | 2 834 | 6.5 | 38.8 | |||
| 机构名称 | 所属国家 | TP/篇 | tp/% | TC/次 | (TC/TP)/(次/篇) | |||||||||
| TP | STP | ITP | STP | ITP | TC | STC | ITC | STC/STP | ITC/ITP | |||||
| 美国地质调查局 | 美国 | 332 | 68 | 264 | 20.5 | 79.5 | 10 809 | 1 754 | 9 055 | 25.8 | 34.3 | |||
| 乌得勒支大学 | 荷兰 | 204 | 32 | 172 | 15.7 | 84.3 | 9 167 | 1 033 | 8 134 | 32.3 | 47.3 | |||
| 路易斯安那州立大学 | 美国 | 188 | 64 | 124 | 34.0 | 66 | 5 840 | 1 846 | 3 994 | 28.8 | 32.2 | |||
| 科罗拉多大学 | 美国 | 183 | 15 | 168 | 8.2 | 91.8 | 11 031 | 521 | 10 510 | 34.7 | 62.6 | |||
| 中国科学院 | 中国 | 175 | 18 | 157 | 10.3 | 89.7 | 2 351 | 103 | 2 248 | 5.7 | 14.3 | |||
| 南安普顿大学 | 英国 | 172 | 22 | 150 | 12.8 | 87.2 | 6 949 | 511 | 6 438 | 23.2 | 42.9 | |||
| 加利福尼亚理工学院 | 美国 | 131 | 10 | 121 | 7.6 | 92.4 | 8 907 | 388 | 8 519 | 38.8 | 70.4 | |||
| 代尔夫特理工大学 | 荷兰 | 127 | 8 | 119 | 6.3 | 93.7 | 4 459 | 103 | 4 356 | 12.9 | 36.6 | |||
| < 美 > 国家海洋和大气局 | 美国 | 117 | 12 | 105 | 10.3 | 89.7 | 4 998 | 709 | 4 289 | 59.1 | 40.8 | |||
| 布里斯托尔大学 | 英国 | 114 | 13 | 101 | 11.4 | 88.6 | 6 256 | 531 | 5 725 | 40.8 | 56.7 | |||
| 哥本哈根大学 | 丹麦 | 112 | 17 | 95 | 15.2 | 84.8 | 2 818 | 379 | 2 439 | 22.3 | 25.7 | |||
| 达勒姆大学 | 英国 | 109 | 14 | 95 | 12.8 | 87.2 | 4 784 | 300 | 4 484 | 21.4 | 47.2 | |||
| 法国国家科学院 | 法国 | 106 | 8 | 98 | 7.5 | 92.5 | 2 496 | 92 | 2 404 | 11.5 | 24.5 | |||
| 澳大利亚国立大学 | 澳大利亚 | 104 | 15 | 89 | 14.4 | 85.6 | 5 805 | 635 | 5 170 | 42.3 | 58.1 | |||
| 剑桥大学 | 英国 | 102 | 5 | 97 | 4.9 | 95.1 | 3 714 | 126 | 3 588 | 25.2 | 37.0 | |||
| 昆士兰大学 | 澳大利亚 | 101 | 12 | 89 | 11.9 | 88.1 | 2 631 | 214 | 2 417 | 17.8 | 27.2 | |||
| 弗罗里达大学 | 美国 | 99 | 13 | 86 | 13.1 | 86.9 | 2 094 | 156 | 1 938 | 12.0 | 22.5 | |||
| 华盛顿大学 | 美国 | 98 | 10 | 88 | 10.2 | 89.8 | 6 735 | 626 | 6 109 | 62.6 | 69.4 | |||
| 哥伦比亚大学 | 美国 | 97 | 9 | 88 | 9.3 | 90.7 | 5 484 | 485 | 4 999 | 53.9 | 56.8 | |||
| 宾夕法尼亚州立大学 | 美国 | 94 | 13 | 81 | 13.8 | 86.2 | 5 062 | 759 | 4 303 | 58.4 | 53.1 | |||
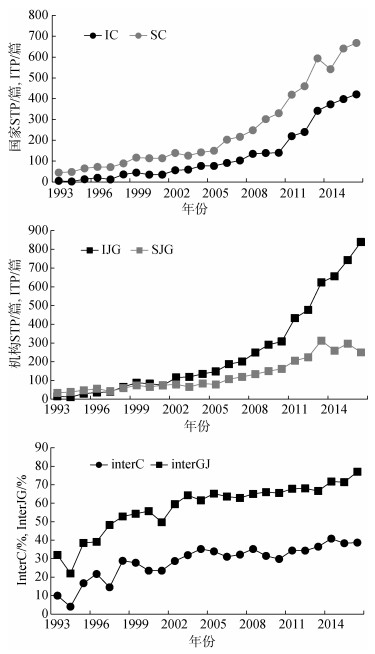
不同国家或机构按时间顺序发文量如图 2, 其中, IC、SC、IJG、SJG分别表示国家合作、独立国家、机构合作、独立机构; interC、interJG分别表示国家、机构合作发文量占该年文献总数的比例。
 |
| 图 2 不同国家和机构发文量变化及他们占总发文量的百分比 Fig. 2 Changes in the number of articles in different countries and institutions and their percentages of total publications |
表 2和表 3中, 美国在海平面上升研究中占主导地位, 发文量最多的国家为美国, 且发文量前20的机构中近半数也属于美国。排名靠前的国家独立发文量占总发文量的比例为40%~60%, 即对发文量较多的国家, 独立发文量与他国合作发文量基本持平, 而对于总发文量较少的国家独立完成文献数占比较低, 文献多为国际合作完成。同时, 国家和机构间的合作文献平均每篇被引次数(ITC/ITP)总体多于独立完成文献的平均每篇被引次数(STC/STP), 表明合作文章更多出经典文献, 总体被使用和受重视程度更高。表 3中机构的独立发文量占总发文量比例明显低于合作发文量所占比例, 图 2中机构合作发文量远高于国家合作发文量。表明国家层面独立研究者较多, 机构则多为合作研究, 未来不同机构之间的合作研究将更加常态化与普遍化。
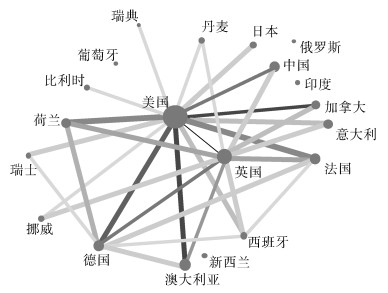
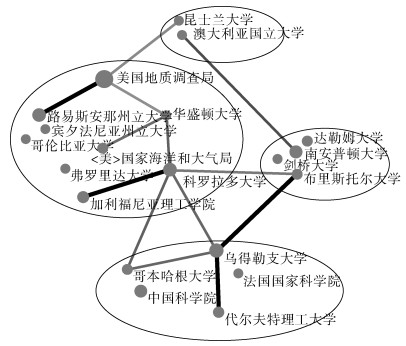
2.2.2 国家、机构间相互联系国家及机构间联系如图 3、图 4。在图 3中美英两国在发文联系网络中呈现“双核”结构。美国处网络图的中心, 在发文量与国际合作中占主导地位, 主要与英, 中, 加等国合作, 英国占次主导地位, 发文量虽少于美国, 但也与众多国家尤其是德和澳合作紧密。图 4将所属美国、澳大利亚、英国以及其他国家的机构集中罗列, 可以看出, 虽然美国地质调查局发文量最大, 但与其他国家联系最多、处网络图中心地位的却是科罗拉多大学, 此外乌得勒支大学与其他机构合作较多, 合作单位所属国家除美国外还有英国、荷兰、丹麦、中国等。
 |
| 图 3 发文量前20名的国家间发文联系网络图 Fig. 3 The collaboration network of the top 20 countries of publications 注:合作发文量低于50篇的不进行连线显示 |
 |
| 图 4 发文量前20名的单位机构间发文联系网络图 Fig. 4 The collaboration network of the top 20 institutions of publications 注:合作发文量低于10篇的不进行连线显示 |
结合图 3与图 4, 不同国家之间发文量比不同单位要多, 但上一节的分析表明不同单位之间的合作比国家间合作更加紧密, 说明同一国家的单位机构间合作紧密, 但分属不同国家的机构相互合作则较少。
2.3 发表期刊统计发文量排名前20的期刊如表 4。研究领域指其在Web of Science中的所属的学科种类: A= geology; B=environmental sciences & ecology; C= physical geography; D=oceanography; E=meteorology & atmospheric sciences; F=water resources; G=marine & freshwater biology; H=paleontology。由表可知, Journal of Coastal Research发表相关文献最多, 高达568篇, 占本研究文献总数的近6%, 原因在于该期刊所属学科种类为geology和environmental sciences & ecology以及physical geography, 它们在所有文献学科种类中排名前三, 即期刊与海平面上升关键词为所有期刊中最契合, 且排名前20的期刊基本都属以上学科种类。所有期刊中平均每篇文献被引频次(TC/TP)基本与该刊的影响因子(IF)成正比, 即影响因子越高的期刊总体被使用和受重视程度更高, 符合一般规律。
| 期刊名称 | TP/篇 | tp/% | TC/次 | (TC/TP)/(次/篇) | IF | 研究领域 |
| Journal of Coastal Research | 568 | 6.07 | 8 209 | 14.5 | 0.915 | A、B、C |
| Marine Geology | 276 | 2.95 | 8 708 | 31.6 | 3.572 | A、D |
| Geophysical Research Letters | 273 | 2.92 | 10 984 | 40.2 | 4.253 | A |
| Palaeogeography Palaeoclimatology Palaeoecology | 200 | 2.14 | 5 443 | 27.2 | 2.578 | A、C、H |
| Climatic Change | 187 | 2 | 5 668 | 30.3 | 3.496 | B、E |
| Estuarine Coastal and Shelf Science | 182 | 1.94 | 5 225 | 28.7 | 2.176 | D、G |
| Sedimentary Geology | 161 | 1.72 | 4 718 | 29.3 | 2.373 | A |
| Quaternary Science Reviews | 160 | 1.71 | 6 371 | 39.8 | 4.797 | A、C |
| Global and Planetary Change | 151 | 1.61 | 5 199 | 34.4 | 3.915 | A、C |
| Ocean & Coastal Management | 148 | 1.58 | 1 661 | 11.2 | 1.861 | D、F |
| Geomorphology | 134 | 1.43 | 2 286 | 17.1 | 2.958 | A、C |
| Quaternary International | 110 | 1.18 | 1 860 | 16.9 | 2.199 | A、C |
| Cryosphere | 109 | 1.16 | 3 109 | 28.5 | 4.803 | A、C |
| Natural Hazards | 101 | 1.08 | 1 288 | 12.8 | 1.833 | A、E、F |
| Geology | 98 | 1.05 | 4 955 | 50.6 | 4.635 | A |
| Journal of Geophysical Research-Oceans | 98 | 1.05 | 2 462 | 25.1 | 2.939 | D |
| Journal of Glaciology | 94 | 1 | 2 508 | 26.7 | 3.643 | A、C |
| Sedimentology | 91 | 0.97 | 2 366 | 26 | 3.638 | A |
| Journal of Geophysical Research-Earth Surface | 89 | 0.95 | 2 504 | 28.1 | 3.412 | A |
| Estuaries and Coasts | 82 | 0.88 | 1 175 | 14.3 | 2.182 | B、G |
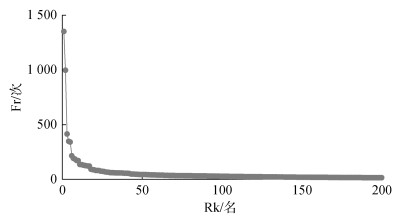
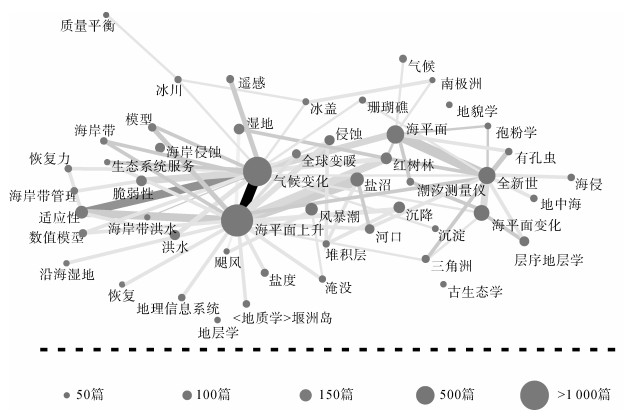
统计所有关键词, 合并同义词后共14 586个, 统计出现频次(Fr)与排名(Rk), 绘制二者相关关系图(图 5), 可以发现除少数关键词如海平面上升(1 351次), 气候变化(997次)外, 大部分关键词的Fr均较低, 14 229个词Fr小于10, 而11 002个关键词仅出现一次。将50个Fr最高的关键词做相互关系图如图 6。将同类词语进行大致划分, 其中与海平面上升(sea level rise)联系最大的为气候变化(climate change), 由此可见海平面上升与全球气候变化有着密不可分的关系。除此外, 关于沿海侵蚀、风暴潮等的研究也与海平面上升有着较大联系。
 |
| 图 5 出现频次最高的前200个关键词的频次与排名相关关系图 Fig. 5 The relationship between the frequencies of the 200 most frequent keywords and their ranks |
 |
| 图 6 出现频次前50的关键词网络图 Fig. 6 The collaboration networks of the top 50 most frequent keywords 注:关联少于10篇的不进行连线显示 |
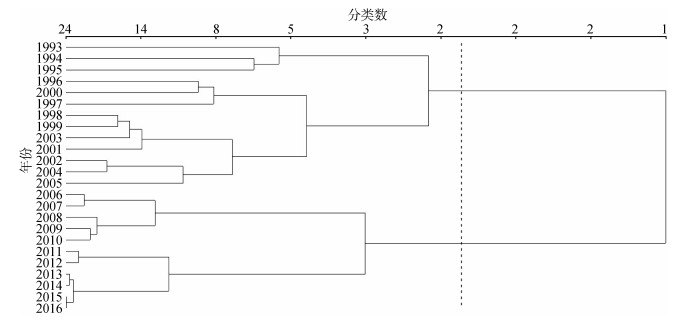
通过层序聚类分析(hierarchical cluster analysis, HCA)将关键词分为两个阶段, 其中, 1993—2005年为第一阶段, 2006—2016年为第二阶段, 图 7。Fr前50的关键词如表 5。
 |
| 图 7 所有关于海平面上升文献关键词分成不同阶段聚类图 Fig. 7 Dendrogram of several periods of sea level rise research based on hierarchical cluster analysis (HCA) of the keywords |
| 关键词 | Fr/次 | Rk/名 | |||||
| 所有时间段 | 第一阶段 | 第二阶段 | 所有时间段 | 第一阶段 | 第二阶段 | ||
| 海平面上升 | 1 351 | 188 | 1 163 | 1 | 1 | 1 | |
| 气候变化 | 997 | 83 | 914 | 2 | 5 | 2 | |
| 海平面 | 415 | 88 | 327 | 3 | 4 | 3 | |
| 全新世 | 348 | 126 | 222 | 4 | 2 | 5 | |
| 海平面变化 | 341 | 109 | 232 | 5 | 3 | 4 | |
| 盐沼 | 216 | 51 | 165 | 6 | 8 | 7 | |
| 适应性 | 193 | 13 | 180 | 7 | 37 | 6 | |
| 风暴潮 | 185 | 28 | 157 | 8 | 10 | 8 | |
| 红树林 | 173 | 32 | 141 | 9 | 9 | 9 | |
| 沉降 | 172 | 59 | 113 | 10 | 7 | 11 | |
| 脆弱性 | 136 | 9 | 127 | 11 | 58 | 10 | |
| 湿地 | 135 | 22 | 113 | 12 | 15 | 11 | |
| 层序地层学 | 131 | 66 | 65 | 13 | 6 | 25 | |
| 洪水 | 128 | 21 | 107 | 14 | 17 | 13 | |
| 侵蚀 | 125 | 26 | 99 | 15 | 11 | 14 | |
| 海岸侵蚀 | 122 | 25 | 97 | 16 | 13 | 16 | |
| 河口 | 121 | 23 | 98 | 17 | 14 | 15 | |
| 全球变暖 | 92 | 22 | 70 | 18 | 15 | 20 | |
| 遥感 | 89 | 6 | 83 | 19 | 100 | 17 | |
| 盐度 | 87 | 12 | 75 | 20 | 42 | 18 | |
| 气候 | 82 | 14 | 68 | 21 | 31 | 21 | |
| 数值模型 | 82 | 15 | 67 | 21 | 28 | 22 | |
| 模型 | 81 | 15 | 66 | 23 | 28 | 23 | |
| 三角洲 | 75 | 17 | 58 | 24 | 21 | 26 | |
| 潮汐测量仪 | 74 | 3 | 71 | 25 | 248 | 19 | |
| 海岸带管理 | 72 | 14 | 58 | 26 | 31 | 26 | |
| 冰川 | 68 | 2 | 66 | 27 | 414 | 23 | |
| 地理信息系统 | 66 | 10 | 56 | 28 | 50 | 28 | |
| 沉淀 | 65 | 13 | 52 | 29 | 37 | 33 | |
| 淹没 | 62 | 8 | 54 | 30 | 71 | 31 | |
| 有孔虫 | 62 | 13 | 49 | 30 | 37 | 37 | |
| 海侵 | 61 | 26 | 35 | 32 | 11 | 50 | |
| 海岸带 | 60 | 5 | 55 | 33 | 122 | 29 | |
| 堆积层 | 60 | 12 | 48 | 33 | 42 | 38 | |
| < 地质学 > 堰洲岛 | 59 | 14 | 45 | 35 | 31 | 40 | |
| 冰盖 | 59 | 5 | 54 | 35 | 122 | 31 | |
| 地中海 | 59 | 9 | 50 | 35 | 58 | 35 | |
| 珊瑚礁 | 58 | 20 | 38 | 38 | 18 | 45 | |
| 恢复力 | 57 | 2 | 55 | 39 | 414 | 29 | |
| 飓风 | 56 | 4 | 52 | 40 | 167 | 33 | |
| 南极洲 | 55 | 5 | 50 | 41 | 122 | 35 | |
| 古生态学 | 54 | 16 | 38 | 42 | 25 | 45 | |
| 孢粉学 | 49 | 16 | 33 | 43 | 25 | 56 | |
| 海岸带洪水 | 48 | 3 | 45 | 44 | 248 | 40 | |
| 地貌学 | 48 | 11 | 37 | 44 | 46 | 49 | |
| 生态系统服务 | 47 | 0 | 47 | 46 | — | 39 | |
| 质量平衡 | 46 | 8 | 38 | 47 | 71 | 45 | |
| 地层学 | 45 | 20 | 25 | 48 | 18 | 83 | |
| 恢复 | 44 | 10 | 34 | 49 | 50 | 53 | |
| 沿海湿地 | 44 | 9 | 35 | 50 | 58 | 50 | |
排名靠前的几个词中, 除与海平面变化和气候变化大致同义的关键词外, 还出现了一个距今约11700 a前的全新世, 全新世海平面变化研究是过去全球变化研究的重点, 也是当今全球变化研究的重点和热点[21-23]。此外, 还有盐沼也是两阶段均排名靠前的关键词, 其多与海平面上升[24-25]及全球变暖相结合研究[26]。
表 5中出现一些第一阶段(1993—2005年)Fr较少甚至没有, 但第二阶段(2006—2016年)急剧增多的关键词。主要分为以下两类:一是由于科技进步技术发展, 人们探究的技术手段发生的变化, 以遥感, 潮汐测量仪关键词为代表。二是由于人们关注热点的变化, 关于海平面上升研究的主要内容及方向也在发生变化, 以冰川、海岸带、生态系统服务功能等词为代表。
3 讨论与结论本研究通过文献分析法从发文量、作者单位、关键词等方面, 探究了全球海平面上升研究的情况。得出结论如下: ①有关海平面上升文献发文量从1993—2016年整体呈上升趋势, 尤其是2010年后, 发文量大增。2013年以前, 美国占全世界发文总量近50%, 但2013年以后, 占比明显下降, 而包括中国在内的其他国家关于海平面上升的研究增多, 发文量大增。②从1993—2016年每年文献页数无明显变化趋势, 但平均每篇文章作者数在增多, 从1993年平均每篇2.4位作者, 到2016年平均每篇文章4.9位作者; 年份越久的文献被引频次越高, 文献引用参考文献的数量逐年增多, 文献之间的联系越来越紧密。③美国处于合作的中心, 在海平面研究中美国占主导地位; 对于总发文量较多的国家如美、英等, 与他国合作的文献与该国独立所发文献量基本持平, 对于发文量较少的国家, 多数为与他国合作文献。④国家独立完成研究较多, 机构则多为相互合作完成研究; 同一国家的单位机构间有非常多的合作, 但分属不同国家的机构相互合作则较少; 国际合作或机构间合作的文献被引用次数多于某国或某机构独立所发文献被引次数, 合作文章总体被使用和受重视程度更高。⑤关于海平面上升文献发文量最高的期刊刊登文献数占本研究文献总数的近6%;刊登较多与海平面上升有关文献的期刊中, 所属学科种类均与geology和environmental sciences & ecology以及physical geography等种类相关。⑥通过关键词研究发现, 除气候变化外, 盐沼、风暴潮等, 是近期海平面上升的研究主流。关键词发展可分为两个阶段, 第一阶段1993—2005年, 第二阶段2006—2016年, 研究热点也逐渐从海平面上升到海平面上升与气候变化之间的联系, 同时延伸到关于“冰川”、“海岸带”等的研究。
本研究数据基于Web of Science核心合集, 相对来说处于全球较权威地位, 但仍不能否认缺失某些国家数据库文献资料, 本研究旨在为更好的理解目前关于海平面上升的研究发展以及趋势走向, 对未来海平面上升研究提供一定参考。
| [1] |
Nicholls R J, Cazenave A. Sea-level rise and its impact on coastal zones[J]. Science, 2010, 328(5985): 1517-1520. DOI:10.1126/science.1185782 |
| [2] |
乔新, 陈戈. 基于11年高度计数据的中国海海平面变化初步研究[J]. 海洋科学, 2008, 32(1): 60-64. Qiao Xin, Chen Ge. A preliminary analysis on the China Sea level using 11 years' TOPEX/Poseidon altimeter data[J]. Marine Sciences, 2008, 32(1): 60-64. |
| [3] |
Kleinosky L R, Yarnal B, Fisher A. Vulnerability of Hampton Roads, Virginia to Storm-Surge Flooding and Sea-Level Rise[J]. Natural Hazards, 2007, 40(1): 43-70. DOI:10.1007/s11069-006-0004-z |
| [4] |
王国栋, 康建成, 韩钦臣, 等. 近代全球及中国海平面变化研究述评[J]. 海洋科学, 2014, 38(5): 114-120. Wang Guodong, Kang Jiancheng, Han Qinchen, et al. A review on sea-level change research in global and the ChinaSea in recent years[J]. Marine Sciences, 2014, 38(5): 114-120. |
| [5] |
Nhan N H. Tidal regime deformation by sea level rise along the coast of the Mekong Delta[J]. Estuarine Coastal & Shelf Science, 2016, 183: 382-391. |
| [6] |
Carnero-Bravo V, Sanchez-Cabeza J A, Ruiz-Fernández A C, et al. Sedimentary records of recent sea level rise and acceleration in the Yucatan Peninsula[J]. Science of the Total Environment, 2016, 573: 1063-1069. DOI:10.1016/j.scitotenv.2016.08.142 |
| [7] |
Cooper J A G, Green A N, Meireles R P, et al. Sandy barrier overstepping and preservation linked to rapid sea level rise and geological setting[J]. Marine Geology, 2016, 382: 80-91. DOI:10.1016/j.margeo.2016.10.003 |
| [8] |
刘超, 徐永生. 1950-2010年PDO对北太平洋地区海平面变化影响的量化与评估[J]. 海洋科学, 2017, 41(4): 88-97. Liu Chao, Xu Yongsheng. Quantification and evaluation of PDO influence on north Pacific SLR during 1950-2010[J]. Marine Sciences, 2017, 41(4): 88-97. |
| [9] |
冯哲, 王永红, 易李达玲. 岬湾海滩剖面中长期变化特征及其控制因素:以青岛石老人海滩为例[J]. 海洋科学, 2016, 40(7): 100-109. Feng Zhe, Wang Yonghong, Yili Daling. Characteristics of long-and medium-term variation in bay beach profiles and associated control factors at Shilaoren Beach, Qingdao[J]. Marine Sciences, 2016, 40(7): 100-109. |
| [10] |
康蕾, 马丽, 刘毅. 珠江三角洲地区未来海平面上升及风暴潮增水的耕地损失预测[J]. 地理学报, 2015, 70(9): 1375-1389. Kang Lei, Ma Li, Liu Yi. Loss evaluation of farmland caused by sea level rise and stormsurge in the Pearl River Delta region under global climate change[J]. Acta Geographica Sinica, 2015, 70(9): 1375-1389. |
| [11] |
Pritchard A. Statistical Bibliography or Bibliometrics[J]. Journal of Documentation, 1969, 25(4): 348-349. |
| [12] |
Bakker F G A D. A bibliometric analysis of 30 years of research and theory on corporate social responsibility and corporate social performance[J]. Business & Society, 2005, 44(3): 283-317. |
| [13] |
Xu Yaoyang, Boeing W J. Mapping biofuel field:A bibliometric evaluation of research output[J]. Renewable & Sustainable Energy Reviews, 2013, 28(8): 82-91. |
| [14] |
Powell A G, Hughes D L, Wheat J R, et al. The 100 most influential manuscripts in gastric cancer:A bibliometric analysis[J]. International Journal of Surgery, 2016, 28: 83-90. DOI:10.1016/j.ijsu.2016.02.028 |
| [15] |
Hew J J. Hall of fame for mobile commerce and its applications:A bibliometric evaluation of a decade and a half (2000-2015)[J]. Telematics & Informatics, 2017, 34(1): 43-66. |
| [16] |
Han W P, Yoon J, Leydesdorff L. The normalization of co-authorship networks in the bibliometric evaluation:The government stimulation programs of China and Korea[J]. Scientometrics, 2016, 109: 1-20. DOI:10.1007/s11192-016-2008-0 |
| [17] |
Eshraghi M, Habibi G, Rahim M B, et al. Bibliometric analysis of lung transplantation research articles[J]. Thoracic & Cardiovascular Surgeon, 2011, 59(2): 108-14. |
| [18] |
Zhang Gangfeng, Xie Shaodong, Ho Y S. A bibliometric analysis of world volatile organic compounds research trends[J]. Scientometrics, 2010, 83(2): 477-492. DOI:10.1007/s11192-009-0065-3 |
| [19] |
Fu Huizeng, Wang Minghuang, Ho Y S. Mapping of drinking water research:A bibliometric analysis of research output during 1992-2011[J]. Science of the Total Environment, 2013, 43(3): 757-765. |
| [20] |
Liu Xingjian, Liang Zhang, Song Hong. Global biodiversity research during 1900-2009:A bibliometric analysis[J]. Biodiversity & Conservation, 2011, 20(4): 807-826. |
| [21] |
Amorosi A, Bruno L, Campo B, et al. Global sea-level control on local parasequence architecture from the Holocene record of the Po Plain, Italy[J]. Marine & Petroleum Geology, 2017, 87: 99-111. |
| [22] |
Li Zhen, Pospelova V, Liu Lejun, et al. High-resolution palynological record of Holocene climatic and oceanographic changes in the northern South China Sea[J]. Palaeogeography Palaeoclimatology Palaeoecology, 2017, 483: 94-124. DOI:10.1016/j.palaeo.2017.03.009 |
| [23] |
Cronin T M, O'Regan M, Pearce C, et al. Deglacial sea level history of the East Siberian Sea and Chukchi Sea margins[J]. Climate of the Past, 2017, 13(9): 1097-1110. DOI:10.5194/cp-13-1097-2017 |
| [24] |
Gesch D B, Brock J C, Parrish C E, et al. Introduction:Special Issue on Advances in Topobathymetric Mapping, Models, and Applications[J]. Journal of Coastal Research, 2016, 76: 1-3. DOI:10.2112/SI76-001 |
| [25] |
Hunter E A, Nibbelink N P, Cooper R J. Threat predictability influences seaside sparrow nest site selection when facing trade-offs from predation and flooding[J]. Animal Behaviour, 2016, 120: 135-142. DOI:10.1016/j.anbehav.2016.08.001 |
| [26] |
Huerta-Ramos G, Moreno-Casasola P, Sosa V. Wetland conservation in the Gulf of Mexico:The example of the salt marsh morning glory, ipomoea sagittata[J]. Wetlands, 2015, 35(4): 1-13. |
 2019, Vol. 43

