
文章信息
- 郑军勇, 毛新燕, 生小萱, 孙健安, 江文胜. 2020.
- ZHENG Jun-yong, MAO Xin-yan, SHENG Xiao-xuan, SUN Jian-an, JIANG Wen-sheng. 2020.
- 象山港溶解无机氮环境容量研究
- Environmental capacity assessment of dissolved inorganic nitrogen in the Xiangshan Bay
- 海洋科学, 44(4): 13-20
- Marine Sciences, 44(4): 13-20.
- http://dx.doi.org/10.11759/hykx20190507002
-
文章历史
- 收稿日期:2019-05-07
- 修回日期:2019-06-21
2. 宁波市环境保护科学研究设计院, 浙江 宁波 315012;
3. 中国海洋大学 环境科学与工程学院, 山东 青岛 266100
2. Ningbo Scientific Research and Design Institute of Environmental Protection, Ningbo 315012, China;
3. College of Environmental Science and Engineering, Ocean University of China, Qingdao 266100, China
象山港位于浙江省北部沿海, 由象山港峡湾、牛鼻水道和佛渡水道三大部分构成(图 1), 海域面积为563 km2, 平均水深为10 m, 是一个纵长约为70 km的典型的狭长型半封闭海湾[1]。自20世纪90年代初, 该海域大力发展临港工农业, 推进网箱养殖等多种渔业生产方式, 区域海洋经济水平迅猛提高, 现已发展成为重要的海水增养殖基地和渔业资源基地[2-4]。随着临港工农业、海洋渔业等的快速发展, 大量溶解无机氮(Dissolved Inorganic Nitrogen, DIN)经河流、水闸等入海口汇入港内[5-7], 同时由于象山港是一个半封闭海湾, 港内(尤其是狭湾处)水交换能力较弱, 水交换时间较长[1], 使得DIN难于向外海输运并滞留湾内, 致使象山港海域富营养化状态日益严峻[4, 8-10]。Zhu等[11]指出DIN是象山港海域主要的污染物且自1982年至2011年DIN含量呈现逐渐增加的趋势。根据《2017年象山港海洋环境公报》数据, 象山港DIN含量在0.16~1.19 mg/L, 平均含量为0.65 mg/L, 劣于第四类海水水质标准, 赤潮等有害藻华现象频发, 对海洋生态、经济、社会效益产生了严重影响[12-14], 因而对DIN实行总量控制是很有必要的。
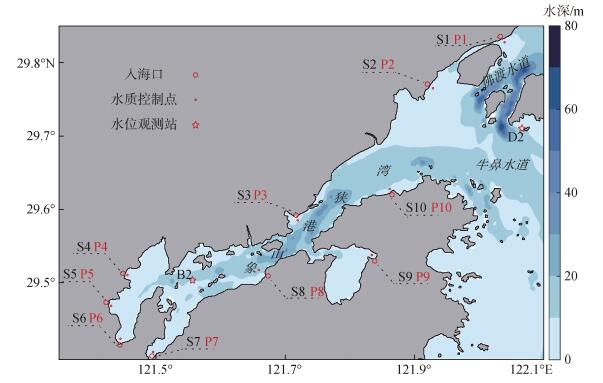 |
| 图 1 象山港水深及各入海口、水质控制点、水位观测站分布 Fig. 1 The distribution of water depth, estuaries, water quality control points, and tidal stations in the Xiangshan Bay 注: S1—S10, P1—P10对应郭巨大碶、联胜新碶、狮子口闸、下陈江、朱娘桥河、凫溪、颜公河、西周排污口、雅林溪、贤庠河的入海口及水质控制点(各入海口口外400 m处); B2, D2为水位周日观测站点 |
计算、优化分配DIN的环境容量是进行DIN总量控制的基础。环境容量是指目标海域在满足某一海水水质标准的要求下, 一定时间范围内污染物的最大允许排海通量[15-17]。针对象山港DIN环境容量, 前人多基于浓度场分担率法进行计算[16-17], 该方法虽简便易行、计算量小, 但其无法对各入海口的排海通量进行优化分配。排海通量最优化法针对该方法的不足, 通过优化分配各入海口的排海通量, 使各水质控制点在满足一定海水水质标准的前提下, 其允许排海通量总和达到最大进而得到目标海域的环境容量。目前该方法已应用于渤海、胶州湾、莱州湾等海域环境容量的计算[15, 18-20]。本文将建立象山港三维水质模型, 对该海域DIN浓度进行数值模拟, 基于排海通量最优化法优化分配各入海口的排海通量并计算该海域DIN的环境容量。
1 研究方法 1.1 模型配置本文通过耦合ROMS(Regional Ocean Model System)及NEMURO(North Pacific Ecosystem Model for Understanding Regional Oceanography)模式, 建立了象山港三维水质模型。其中ROMS模式基于三维非线性斜压原始方程开发, 在近海水动力环境模拟中是一种常用模型; NEMURO模型是一个低营养级水质模型, 最初被应用于北太平洋中部, 后被应用于包括东中国海在内的多个海区[21-23]。模型模拟海区经纬度范围为121.41°E—122.13°E, 29.25°N—29.88°N, 水平方向采用正交经纬网格, 网格数为360×360, 分辨率为(1/500)°, 垂直方向采用地形跟随的S坐标, 共分10层。地形数据由分辨率为600 m的海图数据插值得到[24]。模型综合考虑了风场、潮流、密度流及陆源污染物入海口的共同作用, 其中风场、海表热通量、淡水通量等数据来自COADS(Comprehensive Ocean Atmosphere Data Set)数据集; 潮汐强迫考虑了8个主要分潮M2, S2, K1, O1, N2, K2, P1, Q1的影响; 开边界处水位及流速数据来自SODA(Simple Ocean Data Assimilation)数据集; 陆源污染物入海口考虑了凫溪、颜公河、郭巨大碶等10个入海口(图 1)的影响, 各入海口径流量及DIN数据由宁波市环境保护科学研究设计院提供。凫溪(S6)为港内年径流量最大的河流, 图 2给出了其径流量及DIN排海浓度的季节变化。同时为简化模型, 本文将DIN视作保守物质, 水质模型中部分参数借鉴王玉衡[25]及Liang等[26]的工作。模型对象山港DIN时空分布进行了气候态模拟且运转一年后稳定, 下文工作主要基于第二年模拟结果展开。
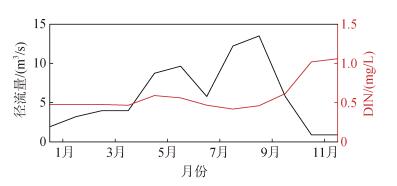 |
| 图 2 凫溪(S6)径流量及DIN排海浓度季节变化 Fig. 2 Seasonal variation of the discharge and DIN emission concentration of Fuxi (S6) |
排海通量最优化法的目标是求解一类最优化问题, 其要求各污染源的允许排海浓度之和达到极大值, 所以目标函数为:
| $ \max \sum\limits_{j = 1}^n {{R_j}, } $ | (1) |
同时各水质控制点的污染物浓度符合目标海域海水水质标准要求, 即:
| $ C_i^0 \le {C_i}, $ | (2) |
而水质控制点污染物浓度大小取决于其与各入海口污染物排海浓度之间的水质响应函数, 就保守物质而言, 水质响应函数一般呈线性关系[15], 所以其约束条件为:
| $ \left( {\begin{array}{*{20}{c}} {{a_{11}}}\\ {{a_{21}}}\\ \vdots \\ {{a_{i1}}} \end{array}\begin{array}{*{20}{c}} {{a_{12}}}\\ {{a_{22}}}\\ \vdots \\ {{a_{i2}}} \end{array}\begin{array}{*{20}{c}} \cdots \\ \cdots \\ \vdots \\ \cdots \end{array}\begin{array}{*{20}{c}} {{a_{1j}}}\\ {{a_{2j}}}\\ \vdots \\ {{a_{ij}}} \end{array}} \right)\left( {\begin{array}{*{20}{c}} {{R_1}}\\ {{R_2}}\\ \vdots \\ {{R_j}} \end{array}} \right) + \left( {\begin{array}{*{20}{c}} {{\beta _1}}\\ {{\beta _2}}\\ \vdots \\ {{\beta _i}} \end{array}} \right) \le \left( {\begin{array}{*{20}{c}} {{C_1}}\\ {{C_2}}\\ \vdots \\ {{C_i}} \end{array}} \right), $ | (3) |
此外, 可对各入海口的污染物最低排海浓度做出约束:
| $ {R_j} \ge {R_{\min }} \ge 0. $ | (4) |
其中i为水质控制点个数, j为入海口个数, Rj为第j个入海口的污染物排海浓度, Rmin为各入海口的污染物最低排海浓度,
首先, 利用湾顶和湾口处的水位周日观测数据进行潮位验证(图 3a, b), 其中内湾B2站(121.56°E, 29.50°N)水深11.5 m, 观测时间为2012年12月19日至20日; 湾口D2站(122.07°E, 29.71°N)水深3.0 m, 观测时间为2012年4月9日至11日[27]。两站相对误差分别为15.08%、16.51%, 变化趋势基本一致; 其次, 参考Jiang等[2]于2010年1、4、7、11月观测所得表层水温数据, 模型能够重现象山港水温的季节变化(图 3c); 第三, 选取宁波市环境保护科学研究设计院提供的DIN浓度现场观测数据与模拟DIN浓度进行比较(图 3d), 两者相对误差(表 1)最大为–19.15%, 最小为–1.82%, 且DIN空间分布均呈现自湾顶至湾口降低的变化趋势。最后, 对水位及表层u、v数据进行潮汐、潮流调和分析(图 4), 象山港潮汐类型属于非正规半日潮, M2分潮占主导地位, 其振幅与迟角自湾口向湾顶逐渐增大。潮流呈往复流特征, M2分潮流椭圆长轴走向基本与岸线平行。潮流流速值最大出现在湾口, 往湾顶流速逐渐减小, 与韩松林等[28]刻画的潮汐潮流特征较为一致。总体来看, 该模型模拟结果与实测数据基本吻合, 能够反映该海域水动力场及DIN浓度的变化规律。
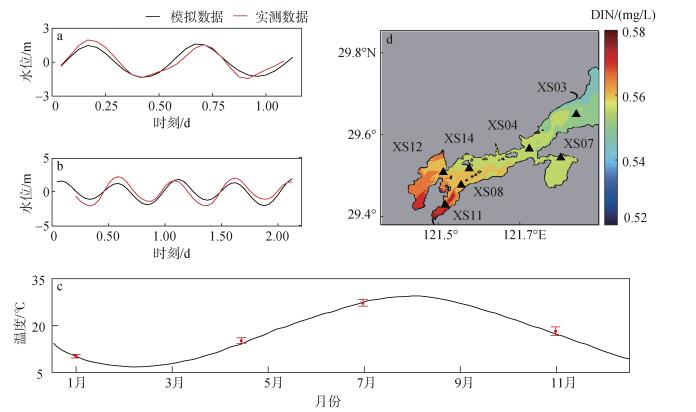 |
| 图 3 B2、D2站点水位(a, b)、月平均海表面温度(c)与DIN浓度(d)模拟与实测数据对比 Fig. 3 Comparison of the modeled and measured data considering the elevation of B2 (a) and D2 (b), monthly mean sea surface temperate (c), and DIN concentrations (d) 注:子图a、b中黑线为模拟数据, 红线为实测数据; c中黑线为模拟数据, 红色误差棒中心点及上下界限分别为海表面温度实测数据平均值及标准差(P < 0.05); d中彩图为海表面DIN浓度模拟结果, ▲为DIN浓度观测站位 |
| 站位 | 实测结果 | 模拟结果 | 相对误差% |
| XS03 | 0.57 | 0.55 | 3.50 |
| XS04 | 0.55 | 0.56 | –1.82 |
| XS07 | 0.50 | 0.55 | –10.00 |
| XS08 | 0.51 | 0.57 | –11.76 |
| XS11 | 0.64 | 0.58 | 9.38 |
| XS12 | 0.47 | 0.56 | –19.15 |
| XS14 | 0.51 | 0.56 | –9.80 |
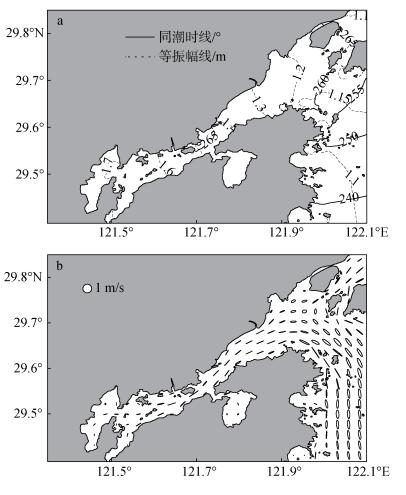 |
| 图 4 象山港M2分潮同潮图(a)与潮流椭圆分布图(b) Fig. 4 The cotidal chart (a) and surface current ellipses distribution of M2 constituent in the Xiangshan Bay (b) |
参考虞兰兰等[20]选取水质控制点的原则, 设置各入海口(S1, S2, …, S10)口外400 m处作为水质控制点(P1, P2, …, P10)。在保持各入海口DIN排海浓度不变的基础上, 利用水质模型依次计算其中一个入海口的DIN排海浓度增大为原来的2、4、6、8、10倍时水质控制点处DIN浓度的变化, 经函数拟合即可建立起该水质控制点处DIN浓度与各入海口的DIN排海浓度之间的水质响应函数。各水质响应函数均呈现明显的线性关系, 主要是由于在模拟过程中, DIN被视为保守物质[15, 19-20]。受篇幅限制, 本文只列出凫溪(S6)口外的水质控制点P6与郭巨大碶(S1)、联胜新碶(S2)、狮子口闸(S3)、下陈江(S4)之间的水质响应函数(图 5)。
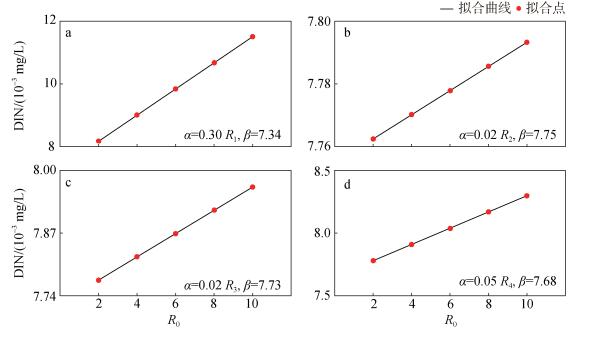 |
| 图 5 水质控制点P6的DIN浓度与部分入海口(S1, S2, S3, S4)的DIN排海浓度的水质响应函数 Fig. 5 Response functions between the DIN concentrations of water quality control point P6 and the DIN emission concentrations of some estuaries (S1, S2, S3, and S4) 注:子图a、b、c、d中a, β对应各水质响应函数的系数及截距 |
结合各水质控制点水质要求及其与各入海口之间的水质响应函数, 目标函数(式1)与约束条件(式2—4)所确定的最优化问题有解的充分条件为各入海口DIN最低排海浓度Rmin介于0~0.17 mg/L。基于此将Rmin自0开始, 以0.01 mg/L递增至0.17 mg/L设置18组线性规划实验, 实验发现不同Rmin的取值对应需要削减的入海口并不相同, 由此可将上述18组线性规划实验结果归纳为a(0≤Rmin≤0.10 mg/L)、b(0.10 < Rmin≤0.12 mg/L)、c(0.12 < Rmin≤0.14 mg/L)、d(0.14 < Rmin≤0.17 mg/L)四类情境:情境a中, 即各入海口DIN最低排海浓度Rmin介于0~0.10 mg/L时, 仅凫溪(S6)与颜公河(S7)需要削减DIN排海通量, 该条件下, DIN环境容量最大, 约为274.17 t/a; 情境b中, 除了上述两个入海口, 西周排污口(S8)也需要削减, 对应的DIN环境容量为249.02 t/a; 情境c中需要削减的入海口更多, 相应的DIN环境容量减小为229.41 t/a; 情境d中, 除郭巨大碶外, 各入海口均需要不同程度地削减DIN排海通量, 此时DIN环境容量最小, 约为127.16 t/a, 其与张永胜[17]基于浓度场分担率法计算的DIN环境容量结果143.21 t/a较为接近。综上, 象山港DIN环境容量为127.16~274.17 t/a, 且其随着Rmin的增大(由情境a至d)逐渐减小(表 2)。
| 入海口 | 现状排放量 | 情境a | 情境b | 情境c | 情境d | |||||||
| 允许量 | 削减量 | 允许量 | 削减量 | 允许量 | 削减量 | 允许量 | 削减量 | |||||
| 凫溪 | 112.62 | 44.02 | 68.60 | 48.46 | 64.17 | 49.32 | 63.30 | 38.92 | 73.71 | |||
| 颜公河 | 160.73 | 11.25 | 149.48 | 13.70 | 147.03 | 15.99 | 144.74 | 18.61 | 142.11 | |||
| 西周排污口 | 39.70 | 39.70 | - | 7.66 | 32.04 | 3.43 | 36.28 | 3.99 | 35.71 | |||
| 下陈江 | 14.67 | 14.67 | - | 14.67 | - | 1.50 | 13.17 | 1.74 | 12.92 | |||
| 朱娘桥河 | 16.09 | 16.09 | - | 16.09 | - | 10.73 | 5.36 | 1.69 | 14.39 | |||
| 联胜新碶 | 57.96 | 57.96 | - | 57.96 | - | 57.96 | - | 44.93 | 13.02 | |||
| 狮子口闸 | 59.03 | 59.03 | - | 59.03 | - | 59.03 | - | 6.70 | 52.33 | |||
| 雅林溪 | 2.15 | 2.15 | - | 2.15 | - | 2.15 | - | 1.69 | 0.46 | |||
| 贤庠河 | 24.40 | 24.40 | - | 24.40 | - | 24.40 | - | 3.99 | 20.42 | |||
| 郭巨大碶 | 4.90 | 4.90 | - | 4.90 | - | 4.90 | - | 4.90 | - | |||
| 合计 | 492.25 | 274.17 | 218.08 | 249.02 | 243.24 | 229.41 | 262.85 | 127.16 | 325.07 | |||
| 注:数字加粗表示该入海口DIN排海通量需要削减 | ||||||||||||
结合表 2可以发现随着Rmin的逐渐增大, 各入海口DIN排海通量需要依次削减, 因而可以按削减优先程度对各入海口做如下分级: Ⅰ级:凫溪(S6)、颜公河(S7); Ⅱ级:西周排污口(S8); Ⅲ级:下陈江(S4)、朱娘桥河(S5); Ⅳ级:联胜新碶(S2)、狮子口闸(S3)、雅林溪(S9)、贤庠河(S10)。水体交换时间指某一海域内保守物质浓度稀释至初始浓度值的一半时所需要的时间, 是描述海湾物质输运的重要指标之一[29]。图 6为各入海口的水体半交换时间及DIN年排海通量分布情况, 由图 6可知Ⅰ级入海口所处海域水体半交换时间最长且DIN年排海通量最大, 表明该海域水体交换能力较弱, DIN难于向外海输运并滞留于该海域, 因而Ⅰ级入海口的DIN排海通量削减优先程度最高; 虽然Ⅲ级入海口(下陈江与朱娘桥河)所处海域水体半交换时间长于Ⅱ级(西周排污口), 但由于西周排污口的DIN年排海通量比III级入海口高了近2.3倍, 因此西周排污口削减优先程度高于两者; Ⅳ级入海口靠近外海, 水体半交换时间较短、水体交换能力较强, 其削减优先程度最低。
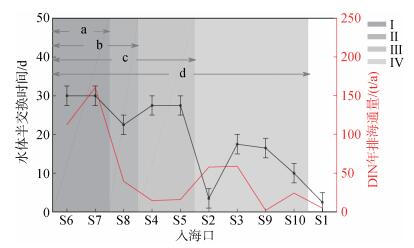 |
| 图 6 各入海口削减优先程度、所处海域水体半交换时间及DIN年排海通量分布 Fig. 6 The reduction priority, water half-exchange time, and annual DIN discharge flux of the estuaries 注: a、b、c、d对应不同Rmin取值范围下的四类情境; 灰度块对应削减优先程度, 自Ⅰ至Ⅳ优先程度逐渐降低; 黑色误差棒中心点及上下界限分别为各入海口所处海域水体半交换时间平均值及极大、极小值 |
本文基于ROMS及NEMURO数值模型, 综合考虑凫溪、颜公河、郭巨大碶等代表性入海口的影响, 建立了象山港三维水质模型, 经检验, 模拟结果与观测结果基本一致, 可用于象山港海域DIN环境容量的计算。在各水质控制点满足海域功能区划要求的前提下, 通过调整Rmin的取值设置了a、b、c、d四类情景并计算了对应情境下的DIN环境容量。结果表明:
(1) 不同情境下, 象山港海域DIN环境容量为127.16~274.17 t/a, 且随着Rmin的增大, DIN环境容量逐渐减小。
(2) 随着Rmin的逐渐增大, 各入海口DIN排海通量依次需要削减, 按削减优先程度可将各入海口划分为Ⅰ、Ⅱ、Ⅲ、Ⅳ四级, 即Ⅰ级凫溪、颜公河, Ⅱ级西周排污口, Ⅲ级下陈江、朱娘桥河, Ⅳ级联胜新碶、狮子口闸、雅林溪、贤庠河。削减优先程度与各入海口所处海域的水体半交换时间及其DIN年排海通量有关:水体半交换时间越长、DIN年排海通量越大, 削减优先程度越高。
| [1] |
董礼先, 苏纪兰. 象山港水交换数值研究Ⅱ.模型应用和水交换研究[J]. 海洋与湖沼, 1999, 30(5): 465-470. Dong Lixian, Su Jilan. Numerical study of water exchange in Xiangshan Bay Ⅱ. Model application and water exchange study[J]. Oceanologia et Limnologia Sinica, 1999, 30(5): 465-470. DOI:10.3321/j.issn:0029-814X.1999.05.001 |
| [2] |
Jiang Z B, Zhu X Y, Gao Y, et al. Spatio-temporal distribution of net-collected phytoplankton community and its response to marine exploitation in Xiangshan Bay[J]. Chinese Journal of Oceanology and Limnology, 2013, 31(4): 762-773. DOI:10.1007/s00343-013-2206-z |
| [3] |
Jiang Z B, Liao Y B, Liu J J, et al. Effects of fish farming on phytoplankton community under the thermal stress caused by a power plant in a eutrophic, semi-enclosed bay:Induce toxic dinoflagellate (Prorocentrum minimum) blooms in cold seasons[J]. Marine Pollution Bulletin, 2013, 76(1-2): 315-324. DOI:10.1016/j.marpolbul.2013.07.006 |
| [4] |
Liang S X, Han S L, Sun Z C, et al. Lagrangian methods for water transport processes in a long-narrow bay-Xiangshan Bay, China[J]. Journal of Hydrodynamics, 2014, 26(4): 558-567. |
| [5] |
郑云龙, 朱红文, 罗益华. 象山港海域水质状况评价[J]. 海洋环境科学, 2000, 19(1): 56-59. Zheng Yunlong, Zhu Hongwen, Luo Yihua. Assessment on the situation of water quality at Xiangshan Port[J]. Marine Environmental Science, 2000, 19(1): 56-59. DOI:10.3969/j.issn.1007-6336.2000.01.013 |
| [6] |
罗益华. 象山港海域水质状况分析与污染防治对策[J]. 污染防治技术, 2008, 21(3): 48-50. Luo Yihua. Water quality actualities and water pollution control measures at Xiangshan Port[J]. Pollution Control Technology, 2008, 21(3): 48-50. |
| [7] |
Ye R, Liu L, Wang Q, Ye X S, et al. Identification of coastal water quality by multivariate statistical techniques in two typical bays of northern Zhejiang Province, East China Sea[J]. Acta Oceanologica Sinica, 2017, 36(2): 1-10. DOI:10.1007/s13131-017-0981-7 |
| [8] |
Li L, Guan W B, He Z G, et al. Responses of water environment to tidal flat reduction in Xiangshan Bay:Part II locally re-suspended sediment dynamics[J]. Estuarine, Coastal and Shelf Science, 2017, 198(5): 114-127. |
| [9] |
Wu H L, Huo Y Z, Han F, et al. Bioremediation using Gracilaria chouae co-cultured with Sparus macrocephalus to manage the nitrogen and phosphorous balance in an IMTA system in Xiangshan Bay, China[J]. Marine Pollution Bulletin, 2015, 91(1): 272-279. |
| [10] |
Yang Z, Chen J F, Li H L, et al. Sources of nitrate in Xiangshan Bay (China), as identified using nitrogen and oxygen isotopes[J]. Estuarine, Coastal and Shelf Science, 2018, 207(3): 109-118. |
| [11] |
Zhu G H, Qian J, Chen L H, et al. The Annual Variations of Major Nutrients and Assessments about Environmental Impacts of Xiangshan Bay East China Sea[J]. Applied Mechanics and Materials, 2013, 316: 395-399. |
| [12] |
张丽旭, 蒋晓山, 蔡燕红. 象山港海水中营养盐分布与富营养化特征分析[J]. 海洋环境科学, 2008, 27(5): 488-491. Zhang Lixu, Jiang Xiaoshan, Cai Yanhong. Characteristics of nutrient distributions and eutrophication in seawater of the Xiangshan Harbor[J]. Marine Environmental Science, 2008, 27(5): 488-491. DOI:10.3969/j.issn.1007-6336.2008.05.020 |
| [13] |
吕华庆, 常抗美, 石钢德. 象山港氮、磷营养盐环流和分布规律的研究[J]. 海洋与湖沼, 2009, 40(2): 138-144. Lv Huaqing, Chang Kangmei, Shi Gangde. Circulation and distribution of nitrogen and phosphorus in Xiangshan Bay, China[J]. Oceanologia et Limnologia Sinica, 2009, 40(2): 138-144. DOI:10.3321/j.issn:0029-814X.2009.02.005 |
| [14] |
Huo Y Z, Wu H L, Chai Z Y, et al. Bioremediation efficiency of Gracilaria verrucosa for an integrated multi-trophic aquaculture system with Pseudosciaena crocea in Xiangshan harbor, China[J]. Aquaculture, 2012, 326-329: 99-105. DOI:10.1016/j.aquaculture.2011.11.002 |
| [15] |
郭良波, 江文胜, 李凤岐, 等. 渤海COD与石油烃环境容量计算[J]. 中国海洋大学学报, 2007, 37(2): 144-150. Guo Liangbo, Jiang Wensheng, Li Fengqi, et al. Environmental Capacity Calculation of COD and PHs in the Bohai Sea[J]. Journal of Ocean University of China, 2007, 37(2): 144-150. |
| [16] |
余静, 孙英兰, 张越美, 等. 宁波-舟山海域入海污染物环境容量研究[J]. 环境污染与防治, 2006, 28(1): 31-34. Yu Jing, Sun Yinglan, Zhang Yuemai, et al. Environmental capacity assessment of pollutants in Ningbo-Zhoushan sea area[J]. Environmental Pollution and Control, 2006, 28(1): 31-34. DOI:10.3969/j.issn.1001-3865.2006.01.010 |
| [17] |
张永胜.浙江省象山港入海污染物总量控制规划研究[D].青岛: 中国海洋大学, 2004. Zhang Yongsheng. A study on total amount control planning of pollutants discharged into Xiangshan bay of Zhejiang province[D]. Qingdao: Ocean University of China, 2004. http://cdmd.cnki.com.cn/Article/CDMD-10423-2004131686.htm |
| [18] |
李克强, 王修林, 阎菊, 等. 胶州湾石油烃污染物环境容量计算[J]. 海洋环境科学, 2003, 22(4): 13-17. Li Keqiang, Wang Xiulin, Yan Ju, et al. Calculation on environmental capacities of petroleum hydrocarbon in Jiaozhou Bay[J]. Marine Environmental Science, 2003, 22(4): 13-17. DOI:10.3969/j.issn.1007-6336.2003.04.004 |
| [19] |
虞洋, 彭昌盛, 虞兰兰, 等. 莱州湾石油烃海洋环境容量计算——基于非线性规划的排海通量最优化法[J]. 海洋环境科学, 2014, 33(2): 293-299. Yu Yang, Peng Changsheng, Yu Lanlan, et al. Environmental capacity calculation of petroleum hydrocarbons in Laizhou Bay——The discharge optimization method based on the nonlinear programming[J]. Marine Environmental Science, 2014, 33(2): 293-299. |
| [20] |
虞兰兰, 陈艳丽, 张海宁, 等. 基于非线性规划的莱州湾营养盐环境容量计算[J]. 海洋科学进展, 2016, 34(2): 304-312. Yu Lanlan, Chen Yanli, Zhang Haining, et al. Environmental capacity calculation of nutrients in the Laizhou Bay based on the nonlinear programming[J]. Advances in Marine Science, 2016, 34(2): 304-312. DOI:10.3969/j.issn.1671-6647.2016.02.015 |
| [21] |
Hashioka T, Yamanaka Y. Seasonal and regional variations of phytoplankton groups by top-down and bottom-up controls obtained by a 3-D ecosystem model[J]. Ecological Modelling, 2007, 202(1-2): 68-80. DOI:10.1016/j.ecolmodel.2006.05.038 |
| [22] |
Kishi M J, Kashiwa M, Ware D, et al. NEMURO-introduction to a lower trophic level model for the North Pacific marine ecosystem[J]. Ecological Modelling, 2007, 202(1-2): 12-25. DOI:10.1016/j.ecolmodel.2006.08.021 |
| [23] |
Kishi M J, Ito S I, Bernard A, et al. A review of the NEMURO and NEMURO.FISH models and their application to marine ecosystem investigations[J]. Journal of Oceanography, 2011, 67(1): 3-16. |
| [24] |
Xu P, Mao X Y, Jiang W S. Mapping tidal residual circulations in the outer Xiangshan Bay using a numerical model[J]. Journal of Marine Systems, 2016, 154: 181-191. DOI:10.1016/j.jmarsys.2015.10.002 |
| [25] |
王玉衡.黄海物理环境对鳀鱼种群动态的影响——基于个体发育的生态动力模型研究[D].青岛: 中国海洋大学, 2011. Wang Yuheng. Influence of physical environment to anchovy population dynamics in the Yellow Sea——a study using individual-based ecosystem model[D]. Qingdao: Ocean University of China, 2011. http://www.wanfangdata.com.cn/details/detail.do?_type=degree&id=D169403 |
| [26] |
Liang S X, Han S L, Sun Z C. Parameter optimization method for the water quality dynamic model based on data-driven theory[J]. Marine Pollution Bulletin, 2015, 98(1-2): 137-147. DOI:10.1016/j.marpolbul.2015.07.004 |
| [27] |
生小萱.象山港拉格朗日余流数值模拟与观测方法研究[D].青岛: 中国海洋大学, 2017. Sheng Xiaoxuan. Numerical simulation of Lagrangian residual current and its observation method in Xiangshan Bay[D]. Qingdao: Ocean University of China, 2017. |
| [28] |
韩松林, 梁书秀, 孙昭晨. 基于FVCOM的象山港海域潮汐潮流与温盐结构特征数值模拟[J]. 水道港口, 2014, 35(5): 481-488. Han Songlin, Liang Shuxiu, Sun Zhaochen. Numerical simulation of tides, tidal currents and temperature-salinity structures in Xiangshan Bay based on FVCOM[J]. Journal of Waterway and Harbor, 2014, 35(5): 481-488. DOI:10.3969/j.issn.1005-8443.2014.05.003 |
| [29] |
彭辉, 姚炎明, 刘莲. 象山港水交换特性研究[J]. 海洋学研究, 2012, 30(4): 1-12. Peng Hui, Yao Yanming, Liu Lian. Study on the features of water exchange in Xiangshan Bay[J]. Journal of Marine Sciences, 2012, 30(4): 1-12. DOI:10.3969/j.issn.1001-909X.2012.04.001 |
 2020, Vol. 44


