 2024, Vol. 48
文章信息
- 田晓露, 毛新燕, 史洁, 王海燕, 张芳苒, 鹿有余. 2024.
- TIAN Xiaolu, MAO Xinyan, SHI Jie, WANG Haiyan, ZHANG Fangran, LU Youyu. 2024.
- 基于卫星遥感资料的2003—2019年南黄海浮游植物春季水华发生时间及其与海面湍动能生成率的关系
- Onset dates of spring phytoplankton bloom in the Southern Yellow Sea during 2003-2019 based on satellite remote sensing data and the relationship with the generation rate of sea surface turbulent kinetic energy
- 海洋科学, 48(11): 1-11
- Marine Sciences, 48(11): 1-11.
- http://dx.doi.org/10.11759/hykx20230916001
-
文章历史
- 收稿日期:2023-09-16
- 修回日期:2024-02-05


2. 中国海洋大学 海洋环境与生态教育部重点实验室, 山东 青岛 266100;
3. 国家海洋环境预报中心, 北京 100080;
4. 北京 5111 信箱, 北京 100094;
5. Bedford Institute of Oceanography, Fisheries and Oceans Canada, Dartmouth, Nova Scotia, Canada B2Y 4A2
2. Key Laboratory of Marine Environment and Ecology, Ministry of Education, Qingdao 266100, China;
3. National Marine Environmental Forecasting Center, Beijing 100080, China;
4. Beijing 5111 Mailbox, Beijing 100094, China;
5. Bedford Institute of Oceanography, Fisheries and Oceans Canada, Dartmouth, Nova Scotia, B2Y 4A2, Canada
海洋浮游植物为浮游动物、鱼类等生物提供直接或间接的饵料, 使能量向更高营养级转化, 是海洋食物网的基础[1-2]。水华是浮游植物种群一次快速、显著增加的现象。中纬度海域每年发生春、秋两次水华, 其中春季水华强度较高, 范围较大, 是一年中浮游生物生产力最高的时期[3-4]。水华的发生时间存在区域和年际差异。当水华发生与浮游动物的增殖高峰相匹配时, 浮游动物产量增加, 进而使更高营养级的渔业增产[3]。黄海为典型的中纬度海域, 研究该海域浮游植物春季水华的发生时间, 对深入认识、保护和利用生态系统及渔业资源具有重要意义。
叶绿素a浓度是海洋浮游植物生物量的重要表征, 其随时间的变化情况可用于判定水华发生时间[5-7]。前人基于现场观测[8-11]、卫星遥感[12-13]等方式获得了叶绿素a浓度资料。两种方式获得的数据优缺点互相补充, 即船基观测资料在时间和空间上覆盖不足, 但可以标定和验证卫星遥感产品; 而卫星遥感产品在远岸区域的可信度高于近岸[14]。已有研究给出了南黄海春季水华的多年平均规律, 指出黄海3—5月发生春季水华, 其中叶绿素a浓度峰值多出现在4月[15-17]。然而, 目前对该海域春季水华发生时间的区域差异和年际变化, 还需要深化认识。
浮游植物水华的发生与水动力、气象、光照条件, 营养盐供给和浮游植物种类特征等因素密切相关[1, 18-23]。关于水华发生的动力学条件, Huisman等[21]提出了临界湍流假说, 认为当光照和营养物质充足时, 若水体垂向混合强烈, 则会妨碍浮游植物稳定存在于真光层中进行光合作用, 导致生物量不能得到有效积累[23]; 而若垂向混合减弱, 则水体稳定性增强, 浮游植物可在上层水体中获得充足的光照以生产, 此时水华才会发生。基于此假说, 许多研究将水华发生时间与影响海水垂向混合的海表动量通量、热通量相联系, 认为春季风应力减弱或海表净热通量由负转正是水华发生的关键条件[11, 24-25]。Stramska[26]则指出风和热通量是通过改变大气向海洋提供的湍动能影响上层水体稳定性, 进而控制水华发生时间, 故海面湍动能生成率(generation rate of turbulent kinetic energy, TKERT)可作为水体垂向混合的量化指标, 成为水华发生的动力条件。TKERT越大, 水体垂向混合越强烈, 则稳定性越差, 会导致水华推迟发生[16-17, 26]。
本研究的思路如下。(1)利用卫星观测的叶绿素a浓度数据, 量化2003—2019年南黄海(119°~127°E, 33°~ 38°N, 图 1)浮游植物春季水华发生时间的空间差异和年际变化。(2)结合气象再分析数据、区域海洋模式得到的海面温度(Sea Surface Temperature, SST, 记为TSS)和上混合层深度(Mixed Layer Depth, MLD, 记为DML)计算TKERT, 并分析其与水华发生时间的空间分布和年际变化的关系。本文的最终目的, 是揭示南黄海浮游植物春季水华发生时间的动力学条件, 为进一步预报打下基础。

本文使用2003—2019年MODIS-Aqua卫星的3级叶绿素a浓度产品(https://oceancolor.gsfc.nasa.gov/l3/order/), 空间分辨率为9 km, 时间分辨率为1 d。受高悬浮物浓度和黄色物质影响, MODIS卫星反演得到的黄海西部近岸海域的叶绿素a浓度被高估[27]。因此, 本文选择南黄海50 m以深海域为具体研究区域。
利用基于NEMO(Nucleus for European Modeling of the Ocean)[28]的区域海洋模式, 模拟了2003—2019年西北太平洋的海洋动力变化。模型的水平分辨率为1/12°; 垂向上采用不等间距的z坐标, 最深的海区为50层。本研究使用了模型输出的日平均TSS数据和0~220 m(共27层)的海水密度数据。前者用于计算海表感热通量; 后者用于计算混合层深度, 即海水密度大于海表密度0.03 kg/m3的深度。
气象数据使用了CFSR再分析数据集(Climate Forecast System Reanalysis, https://rda.ucar.edu/datasets/ds093.1/dataaccess/), 空间分辨率为0.204 5°~0.312 5°。下载变量包括逐小时的短波辐射、长波辐射、10 m高度风速、海面气压、2 m高度气温和比湿。利用块体公式计算海气感热和潜热通量, 从而得到海表净热通量[29]。
1.2 海面湍动能生成率的计算海面湍动能生成率TKERT由风引起的湍动能TKEW和热通量引起的湍动能TKEH两部分组成, 表达式如下[26]:
| $ T K E_{\mathrm{RT}}=m_1 u^{* 3}+m_2 \frac{\alpha g}{\rho_s C_{\mathrm{ps}}} \frac{D_{\mathrm{ML}}}{2}\left(-H_0\right)=T K E_{\mathrm{W}}+T K E_{\mathrm{H}} $ | (1) |
其中
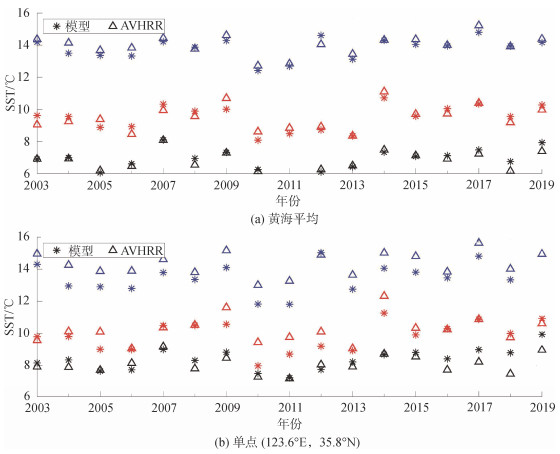
利用2003—2019年的AVHRR遥感TSS资料(https://www.ncei.noaa.gov/products/optimum-interpolation-sst), 对春季水华期(3—5月)模型得到的TSS加以验证。结果显示: 对于黄海空间平均的TSS序列, 两者春季水华期的年际变化一致[图 2(a)], 平均偏差±0.27 ℃。对于黄海中部单点, 3月模拟结果比遥感观测值偏高0.3 ℃, 4月偏低0.4 ℃, 5月偏低0.8 ℃; 从年际变化来看, 二者在单点上的TSS变化基本一致[图 2(b)]。总体来说, 2003—2019年黄海春季水华期间, TSS模拟结果准确, 可用于后续计算和分析。
水华发生时间可以根据叶绿素a浓度达到某设定阈值来判断[31-32]。已有研究结果表明, 南黄海浮游植物春季水华在3—5月间发生[15-17]。本研究也采用阈值法: 首先, 提取每个格点每年3—5月的叶绿素a浓度时间序列; 然后以4 mg/m3为阈值[11], 找到叶绿素a浓度首次大于阈值的时间, 记为t1, 并将前一个有效数据出现的时间记为t2。若某格点叶绿素a浓度在该段时间中未达到阈值, 则当年该格点无春季水华发生。
在阈值法的基础上, 本研究还考虑了日均叶绿素a浓度产品的缺测问题。定义
| $ t_3=\left\{\begin{array}{l} t_1-\frac{\Delta t-1}{2}(\Delta t \text { 为奇数 }) \\ t_1-\frac{\Delta t}{2}(\Delta t \text { 为偶数 }) \end{array},\right. $ | (2) |
则每个t3估计值的最大误差为±Δt/2 d。Δt值越大, 则t3的估计误差越大。为了避免t3的估计误差过大, 我们设定一个界限值Δt*, 将Δt > Δt*的格点数据剔除。若Δt*的取值过小, 会导致剔除的数据过多, 不利于研究水华发生时间的空间分布和年际变化。经过比较, 本研究选择Δt* = 10 d, 可使得每个格点上
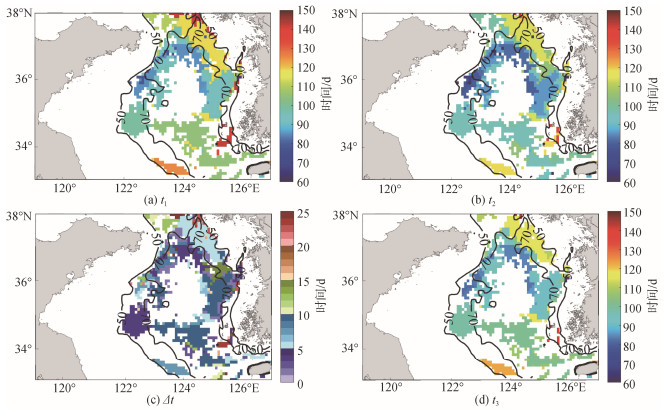 |
| 图 3 2004年各格点水华发生时间的判定过程 Fig. 3 Determination process of the SPB time at each grid point in 2004 |
为更好显示水华发生时间的空间分布, 本文将研究区域划分为70个0.5°×0.5°的单元, 如图 4所示。每个单元中包含36个格点, 考虑到叶绿素a浓度数据的缺测情况, 当有效数据不少于3个时, 则取该组数据的众数作为当年该单元的水华发生时间; 若有效数据量小于3, 则当年该单元没有水华发生时间的估计。对每个单元的水华发生时间, 其误差小于±5 d。
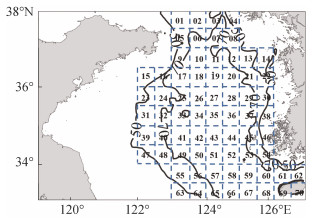 |
| 图 4 研究区域70个单元分布 Fig. 4 Division of the study area into 70 elements |
对每个单元2003—2019年的水华发生时间进行平均, 得到春季水华发生时间的多年平均空间分布[图 5(a)]。将研究区域进一步划分为西部、中部、东部、北部和南部共5个区块, 可以看到: 春季水华在西部和中部区块自西北向东南逐渐推迟; 在靠近朝鲜半岛西岸的东部和北部区块, 以及位于黄、东海交界处的南部区块, 水华发生时间相近并滞后于西部和中部区块。图 5(a)显示的水华发生顺序与郑小慎等[15]的结果基本一致。
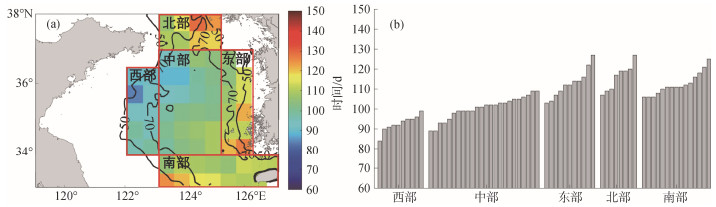 |
| 图 5 (a) 南黄海多年平均春季水华发生时间的空间分布(b) 5个区块内各单元多年平均水华发生时间(由小到大排列) Fig. 5 (a) Spatial distribution of the multi-year averaged SPB time in the southern Yellow Sea; (b) Multi-year averaged SPB time in five subregions |
从每年1月1日开始计算, 西部区块多年平均的水华发生时间为第84—99 d, 即3月下旬至4月上旬; 中部区块在第89—109 d, 也就是4月上旬至中旬, 较西部晚5~10 d; 东部、北部和南部区块为第105—130 d, 即4月中下旬至5月上旬, 较中部区块又晚15~20 d[图 5(a)]。
2.2 南黄海各区块水华发生时间年际变化与多年平均结果基本一致, 2003—2019年间的各个年份, 南黄海春季水华发生时间由西向东逐渐推迟, 东部、北部和南部在相近时间发生水华(图略)。从图 5(b)中提取每个区块多年平均的最早和最晚水华发生时间(图 6实、虚直线); 逐年计算区块平均的水华发生时间(图 6粗黑线加方框), 并得到区块中不同单元水华发生时间的离散情况(图 6阴影)。总体上, 图 6展现了南黄海各区块春季水华发生时间的年际变化。若某年区块平均时间早于最早时间(晚于最晚时间)5 d及以上, 则认为当年该区块水华过早(过晚)发生。
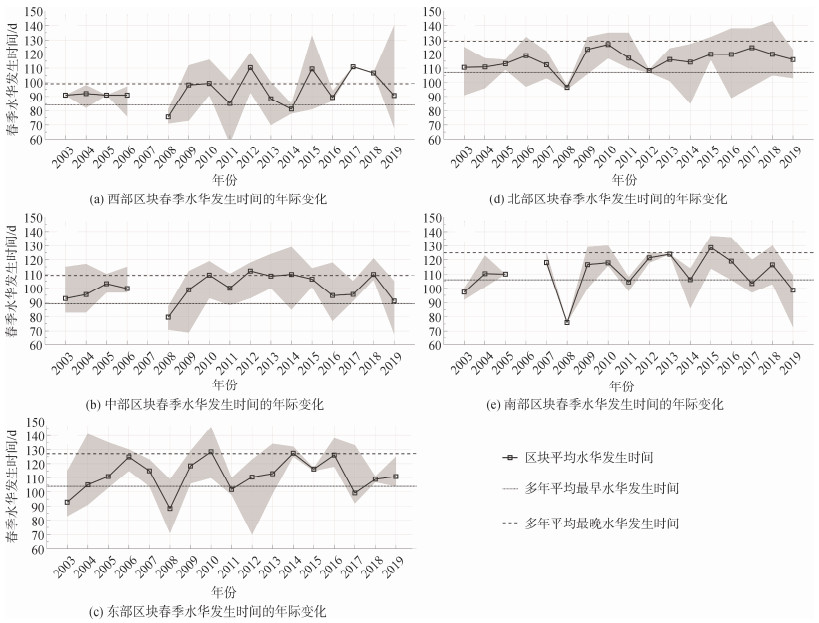 |
| 图 6 2003—2019年5个区块春季水华发生时间的年际变化 Fig. 6 Interannual variation of the SPB time in five subregions of the southern Yellow Sea 注: 黑色实线加方框代表各区块所有单元平均的水华发生时间, 阴影区域代表不同单元水华发生时间的离散程度 |
2003—2019年各区块春季水华发生时间的年际变化如下。中部及北部区块年际变化最小: 前者维持在4月中上旬[图 6(b)], 后者维持在4月下旬[图 6(d)], 两区块仅2008年发生过早水华(提前约10 d)。东部和南部区块的年际变化相对明显[图 6(c), (e)]: 2003和2008年水华均过早发生, 2017年东部区块、2019年南部区块的水华也提前发生。西部区块的年际变化最为显著: 2008年提前了约10 d, 2012、2015、2017和2018年则延后至4月下旬, 较多年平均的最晚时间推迟了约10 d[图 6(a)]。
各区块水华发生时间的异常情况如表 1所示。2008年南黄海春季水华整体提前10 d以上, 为2003—2019年间最显著的异常事件, 其他年份水华提前或推迟发生的区块则不完全一致。
| 年份 | 2003 | 2008 | 2012 | 2015 | 2017 | 2018 | 2019 |
| 西部 | 提前10 d | 推迟11 d | 推迟10 d | 推迟12 d | 推迟7 d | ||
| 中部 | 提前10 d | ||||||
| 东部 | 提前12 d | 提前16 d | 提前6 d | ||||
| 北部 | 提前11 d | ||||||
| 南部 | 提前9 d | 提前30 d | 提前8 d |
由3.2节所述, 中部区块水华发生时间较稳定, 2003—2019年间只有2008年水华异常(过早)发生。等间隔选取该区块6个水华正常发生的年份, 探讨TKERT在上半年的变化及其与水华发生时间的关系(图 7)。在冬季, 海面风速大, 海表净热通量为负, 且DML数值大, 此时为一年中TKERT最高的时期。进入春季后, 风应力减弱, 净热通量不断增长, 加之DML减小, 导致TKERT逐渐减小并向0逼近, 该阶段上层海水趋于稳定。随着海表净热通量由负转正, TKERT出现负值, 水体稳定性进一步增强。然而, 当大风事件或强降温事件发生时, TKERT又会产生波动, 这表明上层水体垂向混合增强, 已建立的水体稳定被破坏。
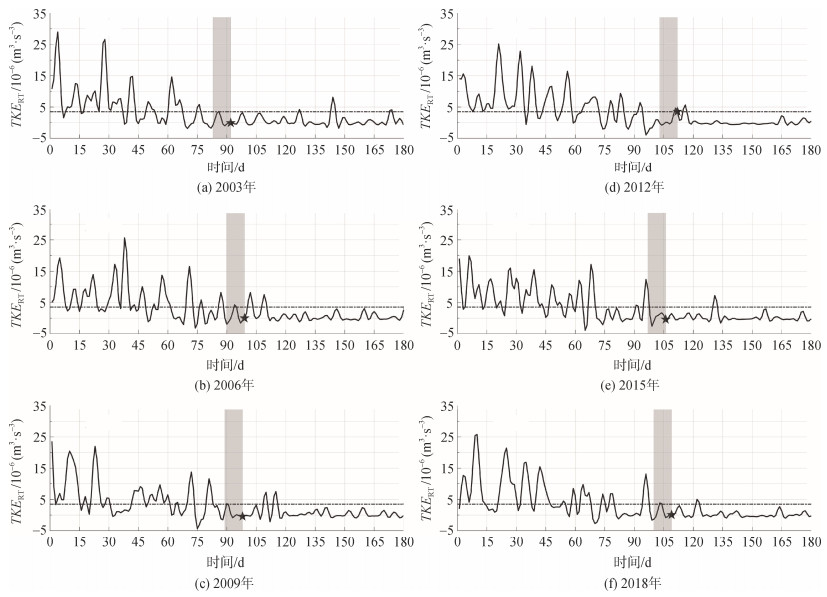 |
| 图 7 中部区块6个不同年份TKERT时间序列 Fig. 7 Time series of TKERT in the central subregion 注: 黑色五角星对应区块平均的水华发生时间, 阴影为水华发生前10 d的时间段, 横线为TKERT等于3.5×10⁻⁶ m3/s3的水平 |
在中部区块的以上6个年份, 水华发生前10 d内(图 7阴影区域), TKERT保持稳定的低值, 均低于5×10⁻⁶ m3/s3, 这与前人的研究结果一致[16]。2003—2019年间, 南黄海5个区块共有82个春季水华样本。计算所有样本水华发生前10 d内TKERT的平均值, 其累积概率分布如图 8所示。当TKERT平均值达到3.5×10⁻⁶ m3/s3时, 累积概率达到100%, 说明在所有水华样本发生之前的10 d内, TKERT的平均值都小于3.5×10⁻⁶ m3/s3。因此, 可以将10 d内TKERT的均值低于3.5×10⁻⁶ m3/s3作为水华发生的动力条件。然而, 图 7也表明, 在2015和2018年, 该条件在水华发生之前20~30 d便已得到满足。这表明上层海洋稳定性只是水华发生的必要动力条件, 而非充分条件。事实上, 营养盐、浮游动物摄食等其他调节浮游植物生长的生物、化学因素同样是决定浮游植物水华发生时间的关键条件。只有在动力条件和生化因素同时适于浮游植物生长时, 水华才能发生[33-34]。
 |
| 图 8 所有区块水华发生前10 d TKERT平均值的累积概率分布 Fig. 8 Cumulative probability of the 10-day averaged TKERT before SPB |
在82个水华样本中, 有13个样本的水华发生时间异常(表 1)。本节将分析这些异常事件所对应的TKERT特征。
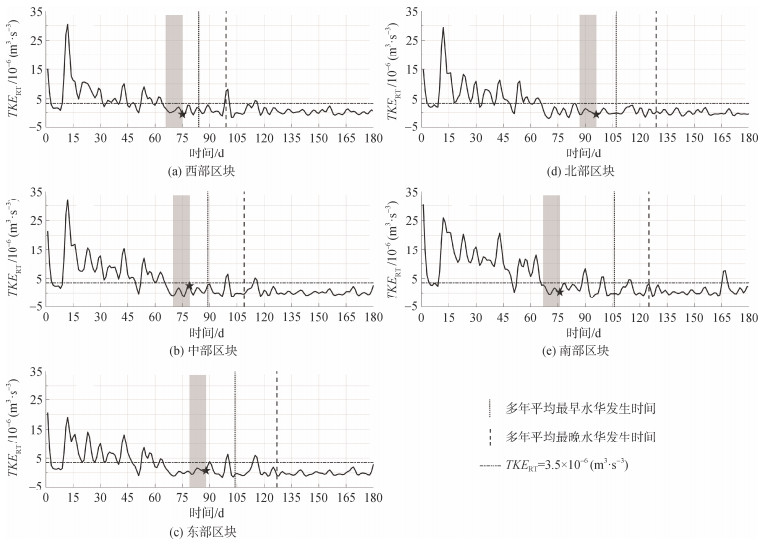
2008年南黄海5个区块都发生过早水华。图 9显示, 当年各区块TKERT满足水华发生动力条件的时间, 均显著提前于多年平均的最早时间。其他4个提前发生的水华样本, TKERT达到水华发生动力条件的时间也明显提前(图 10)。然而, 以上9个过早水华样本中, 有5个在水华发生的20~30 d之前, TKERT已经满足动力条件[例: 图 9(c), (d)]。以上结果表明, 上层海洋稳定性提前增强是南黄海春季水华提前发生的一个必要条件, 但非唯一因素。

除9个过早水华样本之外, 13个异常样本中还包含4个过晚水华, 分别于2012, 2015, 2017和2018年在西部区块发生。图 11显示, 除2017年之外, 其余3年TKERT达到水华发生动力条件的时间也相应延后: 在正常发生水华的时间段, 10 d内TKERT的均值未低于3.5×10⁻⁶ m3/s3, 此时水体垂向混合较强, 浮游植物无法稳定聚集于真光层内, 因此阻碍了水华在正常时段发生; 而在超出最晚水华发生时间之后, 10 d内TKERT的均值才小于3.5×10⁻⁶ m3/s3, 此时水体趋于稳定, 利于浮游植物在真光层内迅速生长繁殖, 使浮游植物生物量显著增加, 从而形成水华。2017年的西部区块是个例外, 在正常发生水华的时间段内, 水体稳定性便已满足水华发生的动力条件, 但该年春季水华仍推迟发生。这可归结为, 控制浮游植物生长的生化因素在该时间段内未与动力条件相匹配, 致使浮游植物生物量不能迅速增长。
4 结论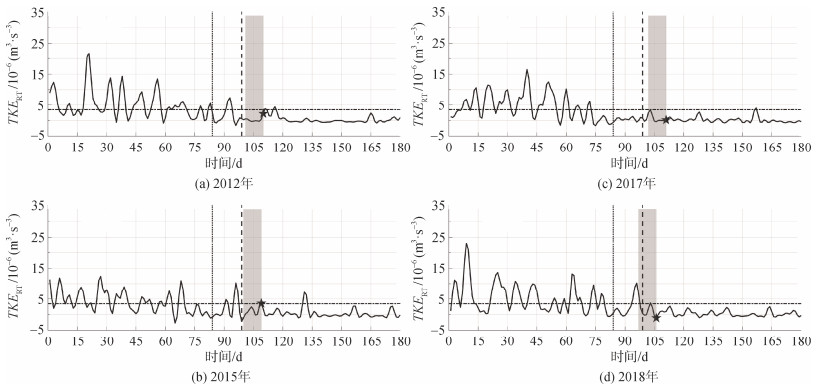
利用2003—2019年MODIS-Aqua卫星的叶绿素a浓度产品, 本文基于阈值法, 估计了南黄海50 m以深区域的浮游植物春季水华发生时间。将研究区域划分为5个区块(西部、中部、东部、北部和南部), 分析了南黄海各区块春季水华发生时间的年际变化。利用大气再分析和区域海洋模式数据, 计算海面湍动能生成率TKERT, 探讨了各区块水华发生时间与TKERT特征的关系。主要结论如下:
1) 南黄海春季水华自西北向东南逐渐推迟, 最早于3月下旬在西部海域发生, 最晚于5月上旬在朝鲜半岛西岸与黄、东海交界处发生, 时间跨度可达约40 d。
2) 2003—2019年间, 中部和北部区块水华发生时间的年际变化较小, 东部和南部区块次之, 西部区块变化最大。2008年南黄海春季水华整体提前10 d以上, 为2003—2019年间最显著的异常事件。
3) 2003—2019年间, 南黄海共有82个春季水华样本。所有样本水华发生前10 d内, 海面湍动能生成率TKERT均保持低值状态(平均值小于3.5×10⁻⁶ m3/s3)。这表明上层海洋足够稳定是南黄海春季水华发生的动力条件。
4) 在部分样本水华发生的20~30 d之前, TKERT代表的上层海洋稳定性便已满足动力条件。这表明上层海洋足够稳定仅是南黄海春季水华发生的必要动力条件, 而非充分条件。在生化因素同样适于浮游植物生长的条件下, 水华才会发生。
本研究量化了南黄海春季水华发生时间的空间差异和年际变化特征, 并在前人的基础上进一步探讨了其与上层海洋稳定性这一动力因素的关系。该研究结果有助于进一步揭示浮游植物水华发生时间变化的机制, 并为春季水华预报提供参考。
| [1] |
韩君, 赵亮, 魏皓. 近岸海域浮游植物水华动力机制研究进展和展望[J]. 中国海洋大学学报(自然科学版), 2008, 38(4): 527-532. HAN Jun, ZHAO Liang, WEI Hao. A review and prospect on the physical mechanisms of phytoplankton blooms in coastal waters[J]. Periodical of Ocean University of China, 2008, 38(4): 527-532. |
| [2] |
SON S, WANG M H, HARDING L W. Satellite-measured net primary production in the Chesapeake Bay[J]. Remote Sensing of Environment, 2014, 144(25): 109-119. |
| [3] |
韩希福, 王荣. 海洋浮游动物对浮游植物水华的摄食与调控作用[J]. 海洋科学, 2001, 25(10): 31-33. HAN Xifu, WANG Rong. The grazing impact and regulation effects of zoo-plankton on phytoplankton bloom[J]. Marine Sciences, 2001, 25(10): 31-33. DOI:10.3969/j.issn.1000-3096.2001.10.011 |
| [4] |
魏皓, 赵亮, 武建平. 浮游植物动力学模型及其在海域富营养化研究中的应用[J]. 地球科学进展, 2001, 16(2): 220-225. WEI Hao, ZHAO Liang. WU Jianping. Review on the numerical models of phytoplankton dynamics and their application in environment management of eutrophication[J]. Advance Earth Sciences, 2001, 16(2): 220-225. DOI:10.3321/j.issn:1001-8166.2001.02.013 |
| [5] |
COLE H S, HENSON A, MARTIN A, et al. Mind the gap: The impact of missing data on the calculation of phytoplankton phenology metrics[J]. Journal of Geoph ysical Research: Oceans, 2012, 117: C08030. |
| [6] |
BRODY S R, LOZIER M S, DUNNE J P, et al. A comparison of methods to determine phytoplankton bloom initiation[J]. Journal of Geophysical Research: Oceans, 2013, 118(5): 2345-2357. DOI:10.1002/jgrc.20167 |
| [7] |
BLONDEAU D, GOWER J F, DEKKER A G, et al. A review of ocean color remote sensing methods and statistical techniques for the detection, mapping and analysis of phytoplankton blooms in coastal and open oceans[J]. Progress in Oceanography, 2014, 123(4): 123-144. |
| [8] |
HAN J, WEI H, ZHAO L, et al. The effects of horizontal advection on the spring bloom of phytoplankton in the central Southern Huanghai Sea[J]. Acta Oceanologica Sinica, 2011, 30(1): 24-31. DOI:10.1007/s13131-011-0087-6 |
| [9] |
XUAN J L, ZHOU F, HUANG D J, et al. Modelling the timing of major spring bloom events in the central Yellow Sea[J]. Estuarine, Coastal and Shelf Science, 2012, 113(10): 283-292. |
| [10] |
ZHAO Y, ZHAO L, XIAO T, et al. Temporal variation of picoplankton in the spring bloom of Yellow Sea, China[J]. Deep-Sea Research Part Ⅱ, 2013, 97(12): 72-84. |
| [11] |
ZHOU F, XUAN J L, HUANG D J, et al. The timing and the magnitude of spring phytoplankton blooms and their relationship with physical forcing in the central Yellow Sea in 2009[J]. Deep-Sea Research Part Ⅱ, 2013, 97(1): 4-15. |
| [12] |
田洪阵, 刘沁萍, JOAQUIM I G, 等. 基于2002—2018年MODIS数据的黄海叶绿素a时空变化研究[J]. 海洋通报, 2020, 39(1): 101-110. TIAN Hongzhen, LIU Qinping, JOAQUIM I G, et al. Temporal and spatial changes in chlorophyll-a concentrations in the Yellow Sea from 2002 to 2018 based on MODIS data[J]. Marine Science Bulletin, 2020, 39(1): 101-110. |
| [13] |
SHANG S L, LEE Z P, WEI G M. Characterization of MODIS-derived euphotic zone depth: Results for the China Sea[J]. Remote Sensing of Environment, 2011, 115(1): 180-186. |
| [14] |
SISWANTO E, TANG J W, YAMAGUCHIET H, et al. Empirical ocean-color algorithms to retrieve chlorophyll-a, total suspended matter, and colored dissolved organic matter absorption coefficient in the Yellow and East China Seas[J]. Journal of Oceanography, 2011, 67(5): 627-650. |
| [15] |
郑小慎, 魏皓, 王玉衡. 基于水色遥感的黄、东海叶绿素a浓度季节和年际变化特征分析[J]. 海洋与湖沼, 2012, 43(3): 649-654. ZHENG Xiaoshen, WEI Hao, WANG Yuheng. Seasonal and inter-annual variations of Chlorophyll-a concentration based on the remote sensing data in Yellow sea and East China Seas[J]. Oceanologia et Limnologia Sinica, 2012, 43(3): 649-654. |
| [16] |
SHI J, LIU Y MAO X Y, et al. Interannual variation of spring phytoplankton bloom and response to turbulent energy generated by atmospheric forcing in the central Southern Yellow Sea of China: Satellite observations and numerical model study[J]. Continental Shelf Research, 2017, 143(1): 257-270. |
| [17] |
LV T, LIU D Y, ZHOU P, et al. The coastal front modulates the timing and magnitude of spring phytoplankton bloom in the Yellow Sea[J]. Water Research, 2022, 220: 118669. |
| [18] |
HOLLIDAY N P, WANIEK J J, DAVIDSON R, et al. Large-scale physical controls on phytoplankton growth in the Irminger Sea Part I: Hydrographic zones, mixing and stratification[J]. Journal of Marine Systems, 2006, 59(3): 201-218. |
| [19] |
WANIEK J J, HOLLIDAY N P. Large-scale physical controls on phytoplankton growth in the Irminger Sea, Part Ⅱ: Model study of the physical and meteorological preconditioning[J]. Journal of Marine Systems, 2006, 59(3): 219-237. |
| [20] |
SVERDRUP H U. On conditions for the vernal blooming of phytoplankton[J]. ICES Journal of Marine Science, 1953, 18(3): 287-295. |
| [21] |
HUISMAN J, VAN OOSTVEEN P, WEISSING F J. Critical depth and critical turbulence: Two different mechanisms for the development of phytoplankton blooms[J]. Limnology and Oceanography, 1999, 44(7): 1781-1787. |
| [22] |
BEHRENFELD M J, BOSS E S. Student's tutorial on bloom hypotheses in the context of phytoplankton annual cycles[J]. Global Change Biology, 2018, 24(1): 55-77. |
| [23] |
UEYAMA R, MONGER B C. Wind-induced modulation of seasonal phytoplankton blooms in the North Atlantic derived from satellite observations[J]. Limnology and Oceanography, 2005, 50(6): 1820-1829. |
| [24] |
KIM H S, YOO I S. Relationship between phytoplankton bloom and wind stress in the sub-polar frontal area of the Japan/East Sea[J]. Journal of Marine Systems, 2007, 67(3): 205-216. |
| [25] |
WANIEK J J. The role of physical forcing in initiation of spring blooms in the northeast Atlantic[J]. Journal of Marine Systems, 2003, 39(1): 57-82. |
| [26] |
STRAMSKA M. Interannual variability of seasonal phytoplankton blooms in the north polar Atlantic in response to atmospheric forcing[J]. Journal of Geophysical Research: Oceans, 2005, 110: C05016. |
| [27] |
HE X Q, BAI Y, PAN D L, et al. Satellite views of the seasonal and interannual variability of phytoplankton blooms in the eastern China seas over the past 14 yr (1998-2011)[J]. Biogeosciences, 2013, 10: 4721-4739. |
| [28] |
LUO X F, WANG Y L, LU Y Y, et al. A 4-month lead predictor of open-water onset in Bering Strait[J]. Geophysical Research Letters, 2020, 47: e2020GL089573. |
| [29] |
GILL A E. Atmosphere-Ocean Dynamics[C]// International Geophysics Series. New York: Academic Press, 1982: 98-101.
|
| [30] |
KRAUS E B, BLECK R, HANSON H P. The inclusion of a surface mixed layer in a layer in a large-scale circulation model[C]//NIHOUL J C J, JAMART B M. Small Scale Turbulence and Mixing in the Ocean. New York: Elsevier, 1988: 51-62.
|
| [31] |
THOMALLA S, FAUCHEREAU N, SWART S. Regional scale characteristics of the seasonal cycle of chlorophyll in the Southern Ocean[J]. Biogeosciences, 2011, 8(10): 2849-2866. |
| [32] |
RACAULT M C, LEQUERE E, BUITENHUIS S, et al. Phytoplankton phenology in the global ocean[J]. Ecological Indicators, 2012, 14(1): 152-163. |
| [33] |
WEI Q S, YU Z G, WANG B D, et al. Coupling of the spatial-temporal distributions of nutrients and physical conditions in the southern Yellow Sea[J]. Journal of Marine Systems, 2016, 156: 30-45. |
| [34] |
JIN J, LIU S M, REN J L. Phosphorus utilization by phytoplankton in the Yellow Sea during spring bloom: Cell surface adsorption and intracellular accumulation[J]. Marine Chemistry, 2021, 231: 103935. |