 2025, Vol. 49
文章信息
- 杨适萌, 郭术津, 郑珊, 朱明亮, 赵永芳, 孙晓霞. 2025.
- YANG Shimeng, GUO Shujin, ZHENG Shan, ZHU Mingliang, ZHAO Yongfang, SUN Xiaoxia. 2025.
- 胶州湾网采浮游植物碳生物量长期变化特征及其影响因素
- Long-term variations in the net-phytoplankton carbon biomass of Jiaozhou Bay and their influencing factors
- 海洋科学, 49(4): 15-24
- Marine Sciences, 49(4): 15-24.
- http://dx.doi.org/10.11759/hykx20240826001
-
文章历史
- 收稿日期:2024-08-26
- 修回日期:2024-11-12


2. 青岛海洋科技中心 海洋生态与环境科学功能实验室, 山东 青岛 266237;
3. 中国科学院海洋大科学研究中心, 山东 青岛 266071;
4. 中国科学院大学, 北京 100049
2. Laboratory of Marine Ecology and Environmental Science, Qingdao Marine Science and Technology Center, Qingdao 266237, China;
3. Center for Ocean MegaScience, Chinese Academy of Sciences, Qingdao 266071, China;
4. University of Chinese Academy of Sciences, Beijing 100049, China
近海生态系统是全球海洋碳储库的主要载体, 浮游植物作为初级生产者, 在近海生态系统物质循环和能量流动中发挥着关键作用[1], 浮游植物类群和生物量直接影响海洋初级生产和碳循环过程[2]。中国的学者针对胶州湾浮游植物群落变化开展了大量的调查研究, 但这些研究大多聚焦于浮游植物的丰度和群落结构变化[3-8]。大量研究结果表明, 随着人类活动和全球气候变化的加剧, 近海浮游植物丰度与群落结构发生了显著变化[9, 10], 且近年来硅藻数量减少, 甲藻数量增多[5, 9], 浮游植物群落由硅藻占据绝对优势, 逐渐转变为硅藻和甲藻共同占优[11]。
由于浮游植物种类繁多, 不同种类细胞的形态和大小存在很大的差异[9]。基于类群丰度的浮游植物生物量研究方法往往忽略了不同浮游植物类群及个体间的形态和大小差异[2]。因此, 明确浮游植物碳生物量的变化规律对于深入认识和理解海洋初级生产和固碳过程至关重要[12]。许多学者提出了浮游植物碳生物量表征浮游植物生物量更为准确, 并建立了浮游植物细胞体积、丰度与碳生物量之间的经验转换公式[13-19], 通过体积参数和丰度数据来计算浮游植物的碳生物量现存量。但目前关于近海浮游植物碳生物量的研究较少, 尤其是缺乏长期变化研究。孙军等[2]利用体积-碳生物量方法探讨了1995—1996年黄海胶州湾海域浮游植物各类群碳生物量的周年变化。杨洋等[10]基于FlowCAM研究了2011—2012年南黄海浮游植物碳生物量的分布、长期变化及群落结构的季节性变动。因此, 本研究以典型海域胶州湾为研究区域, 分析了胶州湾不同区域网采浮游植物碳生物量的长期变化特征及其与环境因子的关系, 为进一步理解近海的生态系统生物生产过程以及海洋固碳提供重要的科学依据。
1 材料与方法 1.1 研究区域研究区域胶州湾是一个半封闭海湾, 通过狭窄湾口与黄海相连。由于胶州湾的水文生态特征沿南北轴线存在显著差异, 可将胶州湾划分为3个主要生态区[20]: 湾北、湾中和湾外。湾北相对封闭, 主要受到陆源输入和人类活动的影响。湾中是胶州湾与外海水体交换的过渡区。湾外受黄海影响较为强烈, 具有外海的属性。本研究分别在湾北、湾中、和湾外各设置一个站位作为3个区域的代表性站位(图 1), 各站位的经纬度以及水深如表 1所示。
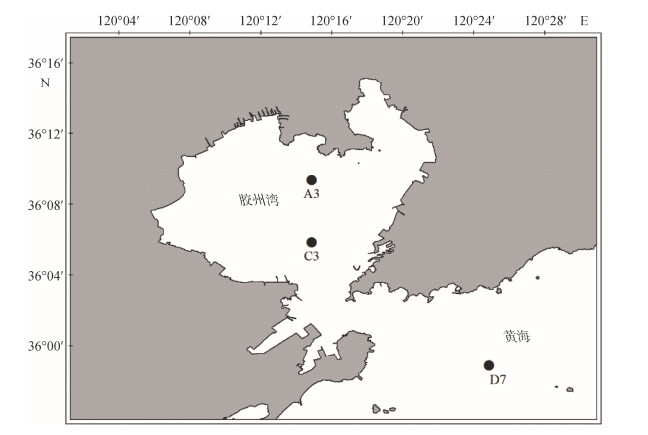 |
| 图 1 调查海域及调查站位信息 Fig. 1 Sampling stations in the study area 注: 该图基于国家测绘地理信息局标准地图服务网站下载的审图号为鲁5G(2022)031号的标准地图制作 |
| 站位 | 经度 | 纬度 | 水深/m | 代表区域 |
| A3 | 120°15′00″E | 36°09′30″N | 5 | 湾北 |
| C3 | 120°15′00″E | 36°06′00″N | 15 | 湾中 |
| D7 | 120°25′30″E | 35°59′00″N | 17 | 湾外 |
本研究于2004—2016年冬季(2月)、春季(5月)、夏季(8月)和秋季(11月)使用Ⅲ型浮游生物网(网口直径37 cm, 网口面积0.1 m2, 网长140 cm, 网目大小为76 μm)进行浮游植物样品采集(2010年样品未获得), 每个站位从水体底部到表层进行垂直拖网。样品采集后立即用5%福尔马林溶液固定保存, 带回实验室进行分析。
每个站位同步采集表层海水测定温度、盐度、溶解无机氮、磷酸盐、硅酸盐等环境参数。温度和盐度现场使用CTD(ALEC AAQ 1183-1F)进行测量。溶解无机氮、磷酸盐、硅酸盐取200 mL表层海水经0.45 μm滤膜过滤后, 在实验室使用QuAAtro分析仪(德国Bran-Lubbe公司)进行测定。本研究中的所有采样和分析方法参考海洋调查规范GB/T 12763.6—2007。
1.3 样品处理与图像扫描本研究参考ÁLVAREZ等[21, 22]使用FlowCAM的方法, 对浮游植物样品进行扫描。操作流程为: 摇匀样品, 取5 mL样品平均分为两份, 分别经过300或600 μm筛绢过滤, 并用过滤海水稀释至合适体积, 获得小于300和300~600 μm两个粒径范围的浮游植物分样。分别使用300和600 μm流通池对两个分样在4倍物镜下进行自动检测分析。扫描结果经浮游植物库比对, 分类、人工校正后, 获得两个粒径范围内的浮游植物细胞丰度和体积参数, 合并后获得整个样品的浮游植物细胞丰度与体积参数。
1.4 碳生物量的获得本研究的碳生物量计算是根据EPPLEY等[15]关于浮游植物细胞体积与碳生物量的经验公式进行转换, 根据FlowCAM自动计算得到的浮游植物细胞丰度与体积数据, 利用以下公式来计算浮游植物细胞的碳生物量[15]:
| $ \log _{10} C=0.76 \times \log _{10} V-0.352, $ | (1) |
| $ \log _{10} C=0.94 \times \log _{10} V-0.600 , $ | (2) |
其中, C为浮游植物细胞的碳生物量值, 单位为pg, V为细胞的体积, 由FlowCAM依据细胞不同形态自动计算获得, 单位为μm3。公式(1)适用于硅藻细胞碳生物量的转换, 公式(2)适用于甲藻细胞碳生物量的转换。
1.5 数据分析与绘图本研究利用SPSS16.0软件进行统计分析, 浮游植物碳生物量与环境因子间关系采用蒙特卡洛检验显著性。运用了典型相关分析(CCA)来探讨浮游植物与环境因素之间的联系。所有图均由origin软件(v 2022)以及Canoco(v 5.0)进行绘制。
2 结果 2.1 胶州湾环境因子变化胶州湾3个区域的环境因子特征以及差异性分析结果如表 2所示。湾北平均温度最高(14.78 ℃±0.58 ℃), 显著高于湾中(14.35 ℃±0.48 ℃)和湾外(14.30 ℃± 0.46 ℃) (P < 0.05)。湾外平均盐度最高(30.99±0.25), 显著高于湾中(30.70±0.47)和湾北(30.28±0.57)(P < 0.05)。湾北平均溶解无机氮浓度最高((26.56±8.91) μmol/L), 显著高于湾中((14.80±6.10) μmol/L)和湾外((8.18± 3.81) μmol/L) (P < 0.05)。湾北磷酸盐浓度最高((0.83±0.35) μmol/L), 湾中最低((0.54±0.32) μmol/L)。湾北平均硅酸盐浓度最高((8.94±2.73) μmol/L), 显著高于湾中((5.50±2.68) μmol/L)和湾外((3.66±1.08) μmol/L) (P < 0.05)。湾中氮磷比最高(92.37±163.97), 湾外最小(34.18±27.00)。湾北平均氮硅比最高(13.16±13.04), 显著高于湾中(6.72±4.77)和湾外(3.26±1.09)(P < 0.05)。
| 环境因子 | 区域 | ||
| 湾北 | 湾中 | 湾外 | |
| 温度/℃ | 14.78±0.58a | 14.35 ± 0.48b | 14.30 ± 0.46b |
| 盐度 | 30.28 ± 0.57b | 30.70±0.47a | 30.99±0.25a |
| 溶解无机氮/(μmol·L–1) | 26.56±8.91a | 14.80±6.10b | 8.18±3.81c |
| 磷酸盐/(μmol·L–1) | 0.83±0.35 | 0.54±0.32 | 0.67±0.68 |
| 硅酸盐/(μmol·L–1) | 8.94±2.73a | 5.50±2.68b | 3.66±1.08b |
| 氮磷比 | 41.81±13.77 | 92.37±163.97 | 34.18±27.00 |
| 氮硅比 | 13.16±13.04a | 6.72±4.77ab | 3.26±1.09b |
| 注: 不同小写字母(a, b, c)代表不同区域间同一环境因子显著差异 | |||
2004—2016年间, 湾北浮游植物的年平均碳生物量的长期变化规律如图 2a所示。湾北年平均碳生物量呈现明显的上升趋势, 尤其是在2014年以后, 维持在一个较高的水平(较2004年提高了4~5倍)。年平均碳生物量的平均值约为(4.22±3.59) mgC/m3, 其中2005年的年平均碳生物量最低, 仅为1.05 mgC/m3, 2016年的年平均碳生物量值最高, 约为11.62 mgC/m3。硅藻碳生物量的长期变化规律如图 2b所示, 其变化趋势与年平均碳生物量的变化趋势基本一致, 整体上也呈现明显的上升趋势, 且在2014年以后维持在较高的水平。硅藻碳生物量的平均值约为(3.75± 3.66) mgC/m3, 其中最低值出现在2005年, 仅为0.52 mgC/m3, 最高值出现在2016年, 约为11.39 mgC/m3。甲藻碳生物量的长期变化规律如图 2c所示, 甲藻碳生物量的平均值约为(0.46±0.47) mgC/m3。甲藻碳生物量在2008年达到最大值, 约为1.94 mgC/m3, 占全年年平均碳生物量的58.38%, 其他年份碳生物量均在一定水平内波动((0.08~ 0.53) mgC/m3), 最低值在2013年, 仅为0.08 mgC/m3。甲藻碳生物量与硅藻碳生物量的比值(甲藻/硅藻)可以在一定程度上反映甲藻和硅藻对浮游植物碳生物量的贡献程度, 如图 2d中结果显示2004—2008年, 甲藻/硅藻呈明显的上升趋势, 从2004年的0.52上升到2008年的1.40, 提升了接近3倍。2008—2016年, 甲藻/硅藻呈明显的下降趋势, 并于2013年后维持在较低的水平, 最低值出现在2013年, 仅为0.02。
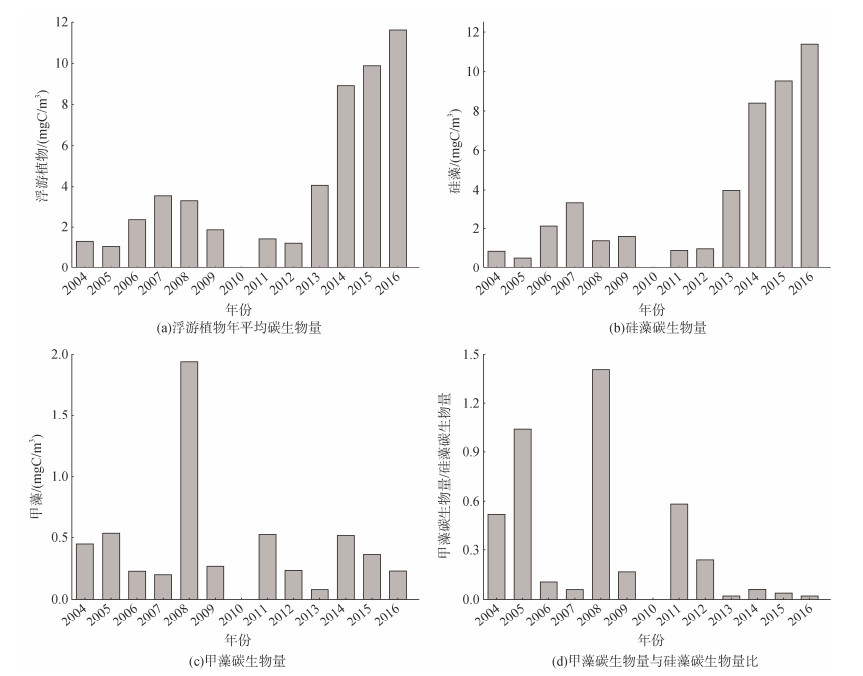 |
| 图 2 胶州湾湾北区域浮游植物年平均碳生物量的长期变化 Fig. 2 Long-term changes in the annual mean carbon biomass of phytoplankton in the northern region of Jiaozhou Bay |
胶州湾湾中区域碳生物量变化分为两个时期如图 3a所示: 2004—2008年呈现明显的下降趋势, 由2004年的最高值4.17 mgC/m3下降到2008年的1.11 mgC/m3; 2008—2016年呈明显的上升趋势, 2016年达到最大值, 约为3.53 mgC/m3。年平均碳生物量的平均值约为(2.34± 1.01) mgC/m3。如图 3b所示, 硅藻碳生物量呈现明显的下降趋势, 仅在2016年有所恢复, 最高值在2004年, 约为2.87 mgC/m3, 最低值在2013年, 仅为0.25 mgC/m3, 硅藻碳生物量的平均值约为(1.26±0.62) mgC/m3。图 3c显示甲藻碳生物量的长期变化趋势呈现出先下降后上升的趋势, 最低值在2008年(0.06 mgC/m3), 最高值在2014年(2.39 mgC/m3), 甲藻碳生物量的平均值约为(1.08± 0.68)mgC/m3。图 3d所示, 甲藻/硅藻在2004—2015年呈明显的上升趋势, 2016年有所下降。
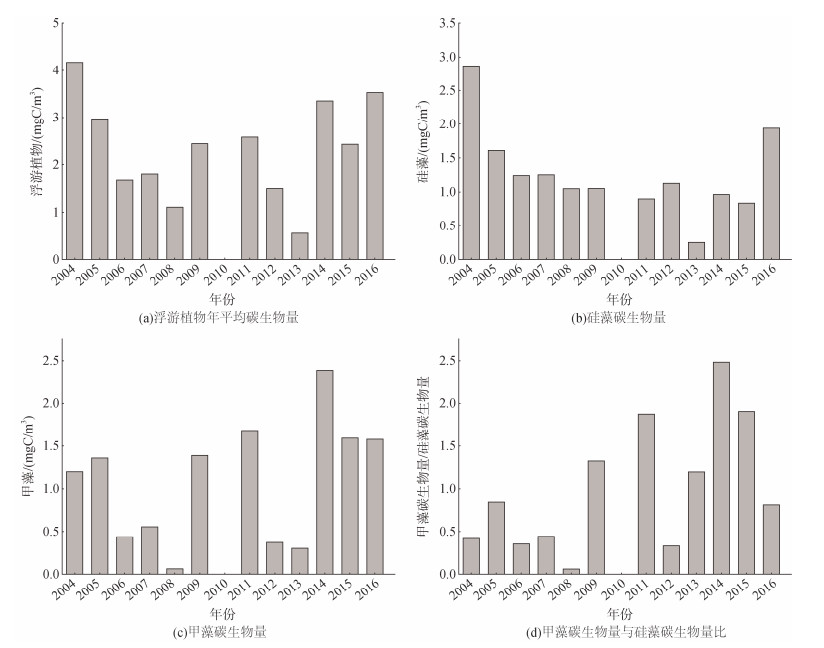 |
| 图 3 胶州湾湾中区域浮游植物年平均碳生物量的长期变化 Fig. 3 Long-term changes in the annual mean carbon biomass of phytoplankton in the central Jiaozhou Bay area |
胶州湾湾外区域浮游植物的年平均碳生物量的长期变化规律如图 4a所示。年平均碳生物量的长期变化分为两个时期: 2004—2009年呈现明显的上升趋势; 2011—2016年下降, 并恢复到2004年的水平。这与湾中区域浮游植物年平均碳生物量的变化趋势正好相反。年平均碳生物量的均值约为(2.52± 1.79)mgC/m3。图 4b显示硅藻碳生物量的变化趋势与年平均碳生物量的变化趋势保持一致, 最高值出现在2005年, 高达4.13 mgC/m3, 最低值出现在2013年, 仅为0.20 mgC/m3, 平均值约为(1.50±1.20) mgC/m3。如图 4c所示, 甲藻碳生物量的波动较为剧烈, 尤其是在2005年和2009年出现两次峰值, 分别达到了2.61和2.46 mgC/m3, 而且峰值之后伴随着连续的下降, 平均4~5年为1个变化的周期。具体来看, 2005年达到峰值, 2005—2008年呈现明显的下降趋势, 然后2009年急剧升高, 随后2009—2013年明显下降; 2014年急剧增加, 随后2014—2016年明显下降。甲藻碳生物量的平均值约为(1.01±0.76) mgC/m3。湾外区域甲藻/硅藻碳生物量整体上呈现上升的趋势, 这表明在湾外甲藻对碳生物量的贡献正在逐渐增加。
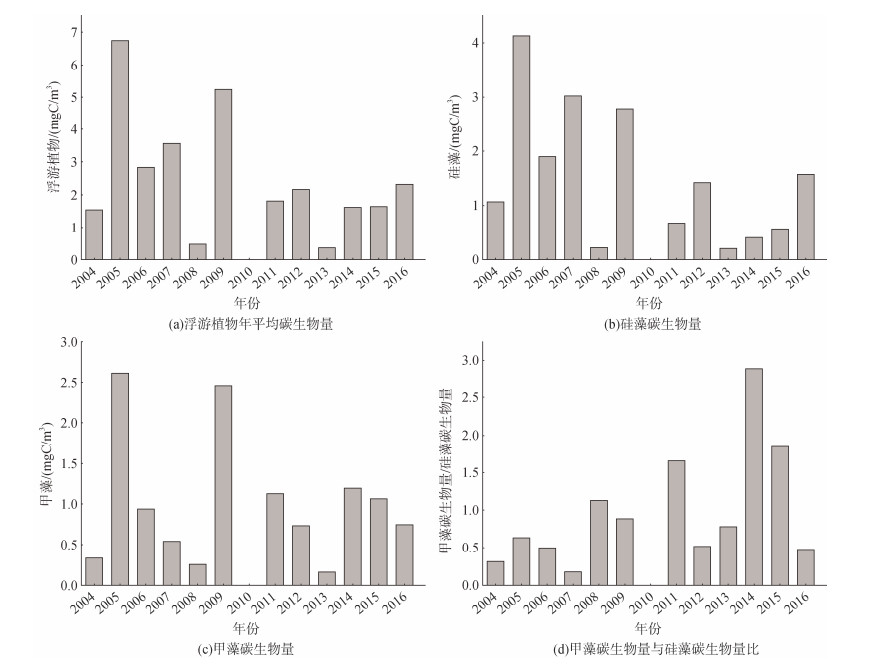 |
| 图 4 胶州湾湾外区域浮游植物年平均碳生物量的长期变化 Fig. 4 Long-term changes in the annual mean carbon biomass of phytoplankton in the Jiaozhou Bay outer region |
对不同区域平均碳生物量的季节变化模式进行了多重比较分析, 结果如图 5所示。湾北浮游植物碳生物量在夏季最高, 平均值为(9.34±11.49) mgC/m3, 春季的平均值最低, 仅为(0.87±1.51) mgC/m3。其中, 夏季与春季的碳生物量存在极显著的差异(P < 0.01), 与秋季的碳生物量存在显著的差异(P < 0.05)。湾中浮游植物碳生物量在冬季最高, 平均值为(2.91±2.61) mgC/m3, 春季的平均值最低, 仅为(0.55±0.57) mgC/m3。其中, 春季碳生物量与冬季、夏季碳生物量存在显著的差异(P < 0.05)。湾外浮游植物碳生物量在冬季最高, 平均值为(5.19±4.25) mgC/m3, 春季的平均值最低, 仅为(0.50±1.04) mgC/m3。其中, 冬季碳生物量与春季、夏季和秋季碳生物量均存在显著的差异(P < 0.05)。
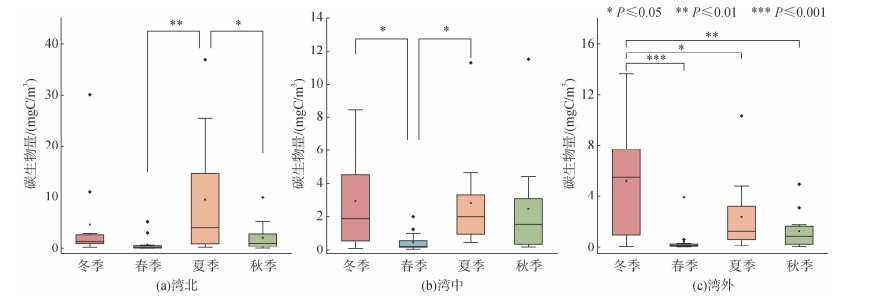 |
| 图 5 胶州湾不同区域浮游植物碳生物量的季节差异 Fig. 5 Seasonal variations in phytoplankton carbon biomass from different regions in the Jiaozhou Bay |
本文进一步分析了胶州湾浮游植物碳生物量与环境之间的相关性, 结果如图 6所示, 表明温度是影响胶州湾浮游植物碳生物量长期变化最关键的环境因子, 其次为磷酸盐和溶解无机氮(表 3)。其中, 年平均碳生物量和硅藻碳生物量与温度呈显著的负相关关系(P < 0.05)。甲藻碳生物量与溶解无机氮呈显著的正相关关系(P < 0.05)。甲藻/硅藻碳生物量比与温度呈显著的正相关关系(P < 0.05)。
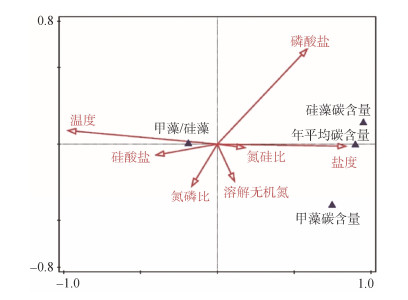 |
| 图 6 胶州湾浮游植物碳生物量与环境因子之间的相关性分析 Fig. 6 Correlations between phytoplankton carbon biomass and environmental factors in the Jiaozhou Bay |
| 环境因子 | 解释度/% | 贡献度/% | F值 | P值 |
| 温度 | 60.7 | 91.7 | 222 | 0.002** |
| 磷酸盐 | 2.9 | 4.4 | 11.40 | 0.002** |
| 盐度 | 0.8 | 1.2 | 3.2 | 0.064 |
| 溶解无机氮 | 1.1 | 1.7 | 4.7 | 0.01** |
| 氮硅比 | 0.5 | 0.8 | 2.0 | 0.122 |
| 氮磷比 | < 0.1 | 0.1 | 0.4 | 0.506 |
| 硅酸盐 | < 0.1 | < 0.1 | 0.2 | 0.846 |
| 注: **. 环境因子与碳生物量呈显著相关(P < 0.05) | ||||
浮游植物不仅是海洋初级生产者, 还在碳循环中扮演关键角色。浮游植物碳生物量的长期变化能够反映出环境因子的波动及其对生态系统的响应[12]。本研究基于分析2004—2016年间胶州湾不同区域浮游植物碳生物量的变化规律及其与环境因子的相关性, 通过了解中国北方海域的浮游植物群落的动态变化及影响因子, 为深入认识近海生态系统的演变与生态保护管理提供了科学依据。
胶州湾不同区域的浮游植物碳生物量的长期变化特征表现出显著差异。湾北浮游植物年平均碳生物量呈上升趋势, 湾中浮游植物碳生物量处于波动状态, 湾外浮游植物碳生物量则呈现下降趋势。湾北的浮游植物组成以硅藻占据较高比例, 浮游植物碳生物量呈现上升趋势主要是由于硅藻碳生物量的增加。甲藻的碳生物量在大多数年份相对较低, 但在某些年份甲藻的碳生物量与硅藻碳生物量相当甚至超过硅藻。如2008年甲藻碳生物量显著增加, 占全年年平均碳生物量的58.38%, 这种异常增高与角藻的数量增加有关。相比湾中和湾外, 湾北距离海岸较近, 受陆源输入的影响, 溶解无机氮和硅酸盐浓度水平较高(表 2), 为浮游植物特别是硅藻生长提供了较充足的物质基础[23, 24]。
胶州湾不同区域浮游植物碳生物量存在着显著的季节变化模式差异, 湾北区域的浮游植物碳生物量在夏季达到峰值, 夏季平均值为9.34 mgC/m3, 而春季最低, 仅为0.87 mgC/m3。夏季碳生物量高可能与适宜的温度和充足的光照密切相关, 这些条件为硅藻的快速繁殖创造了有利环境[25]。同时, 夏季营养盐供应的增加(河流输入的加剧)也进一步促进了浮游植物的高生产力[26, 27]。湾中和湾外则表现出不同的季节模式, 碳生物量在冬季达到最高。湾北冬季碳生物量为2.91 mgC/m3, 湾外为5.19 mgC/m3。这可能与冬季水体混合加强、营养盐再循环以及海水交换加剧有关, 使得这些区域在冬季具备更多的营养供应, 从而提高了浮游植物的生产力[28, 29]。
研究结果表明, 温度、磷酸盐和溶解无机氮是影响胶州湾浮游植物碳生物量的关键环境因子。胶州湾浮游植物年平均碳生物量和硅藻碳生物量与表层海水温度呈负相关关系, 且各区域表层海水温度变化与浮游植物平均碳生物量及硅藻碳生物量的变化均表现出了很好的对应关系, 这一发现能够为进一步开展不同温度场景下浮游植物碳生物量的演变趋势预测提供重要的理论依据和经验参数。磷酸盐和溶解无机氮作为关键营养盐, 其浓度的变化直接影响浮游植物的生长, 尤其是对硅藻的生产力有重要推动作用。磷酸盐和氮的增加为浮游植物, 特别是硅藻, 提供了充足的营养来源, 促进了其碳生物量的增加[30]。同时, 甲藻/硅藻碳生物量比值与温度呈正相关, 反映出相对较高温度下甲藻的竞争优势增强, 可能因为甲藻在较高温度下繁殖速度较快[31]。
4 结论本研究通过分析2004—2016年间胶州湾不同区域浮游植物碳生物量的长期变化特征, 揭示了其动态变化规律及其与环境因子的关系。胶州湾浮游植物碳生物量在不同区域上存在显著差异, 湾北区域浮游植物碳生物量显著上升, 受人类活动影响显著; 湾中呈现波动状态, 湾外由于受外海的影响较大, 浮游植物碳生物量显著下降。胶州湾不同区域浮游植物碳生物量的季节分布模式不同。湾北表现为夏季最高, 湾中和湾外都表现为冬季最高。温度、磷酸盐和溶解无机氮是影响胶州湾浮游植物碳生物量长期变化的关键环境因子。其中, 温度是影响最显著的环境因子。本研究为进一步理解全球变化背景下近海生态系统演变与关键固碳过程提供了新见解, 为未来开展基于生态系统的管理相关决策制定提供重要科学依据。
致谢: 本研究中的海上调查和样品采集工作得到了中国科学院海洋所胶州湾海洋生态系统研究站的各位老师、同学以及“创新号”考察船全体工作人员的支持, 谨致谢忱。
| [1] |
吴玉霖, 孙松, 张永山. 环境长期变化对胶州湾浮游植物群落结构的影响[J]. 海洋与湖沼, 2005, 36(6): 9-20. WU Yulin, SUN Song, ZHANG Yongshan. Long-term changes of environment and its influence on phytoplankton community structure in Jiaozhou Bay[J]. Oceanology et Limnologia Sinica, 2005, 36(6): 9-20. |
| [2] |
孙军, 刘东艳, 钱树本. 浮游植物生物量研究Ⅱ. 胶州湾网采浮游植物细胞体积转换生物量[J]. 海洋学报, 2000, 22(1): 102-109. SUN Jun, LIU Dongyan, QIAN Shuben. Study on phytoplankton biomass Ⅱ. Net-phytoplankton measurement biomass estimated from the cell volume in the Jiaozhou Bay[J]. Acta Oceanology Sinica, 2000, 22(1): 102-109. |
| [3] |
李冠国, 黄世玫. 青岛近海浮游硅藻季节变化研究的初步报告[J]. 山东大学学报, 1956, 2(4): 119-143. LI Guanguo, HUANG Shimei. Seasonal variation of plankton diatoms at Tsingtao[J]. Journal of Shandong University, 1956, 2(4): 119-143. |
| [4] |
钱树本, 王筱庆, 陈国蔚. 胶州湾的浮游藻类[J]. 山东海洋学院学报, 1983, 13(1): 39-56. QIAN Shuben, WANG Xiaoqing, CHEN Guowei. The phytoplankton of the Jiaozhou Bay[J]. Journal of Shangdong College of Oceanology, 1983, 13(1): 39-56. |
| [5] |
孙晓霞, 孙松, 吴玉霖, 等. 胶州湾网采浮游植物群落结构的长期变化[J]. 海洋与湖沼, 2011, 42(5): 639-646. SUN Xiaoxia, SUN Song, WU Yulin, et al. Long-term changes of phytoplankton community structure in the Jiaozhou Bay[J]. Oceanology et Limnologia Sinica, 2011, 42(5): 639-646. |
| [6] |
郑珊, 孙晓霞, 赵永芳, 等. 2010年胶州湾网采浮游植物种类组成与数量的周年变化[J]. 海洋科学, 2014, 38(11): 1-6. ZHENG Shan, SUN Xiaoxia, ZHAO Yongfang, et al. Annual variation of species composition and abundance distribution of phytoplankton in 2010 in the Jiaozhou Bay[J]. Marine Sciences, 2014, 38(11): 1-6. DOI:10.11759/hykx20130222002 |
| [7] |
罗璇, 孙晓霞, 郑珊, 等. 2011年胶州湾网采浮游植物群落结构及其环境影响因子[J]. 海洋与湖沼, 2016, 47(5): 915-923. LUO Xuan, SUN Xiaoxia, ZHENG Shan, et al. On phytoplankton community structure and causative factors in the Jiaozhou Bay in 2011[J]. Oceanology et Limnologia Sinica, 2016, 47(5): 915-923. |
| [8] |
陈芸燕, 孙晓霞, 朱明亮. 基于浮游植物流式细胞仪对胶州湾春季浮游植物的研究[J]. 海洋科学, 2017, 41(6): 72-78. CHEN Yunyan, SUN Xiaoxia, ZHU Mingliang. High-resolution analysis of Jiaozhou Bay phytoplankton community structure based on automated submerged flow cytometer during spring[J]. Marine Sciences, 2017, 41(6): 72-78. DOI:10.11759/hykx 20160726001 |
| [9] |
孙晓霞, 孙松. 胶州湾浮游植物粒级结构及其时空变化[J]. 海洋与湖沼, 2012, 43(3): 411-418. SUN Xiaoxia, SUN Song. Phytoplankton size structure and its temporal and spatial change in Jiaozhou Bay[J]. Oceanology et Limnologia Sinica, 2012, 43(3): 411-418. |
| [10] |
杨洋, 孙晓霞, 郑珊, 等. 南黄海夏初网采浮游植物分布与长期变化[J]. 海洋与湖沼, 2016, 47(4): 755-763. YANG Yang, SUN Xiaoxia, ZHENG Shan, et al. Distribution and long-term variation of net phytoplankton in South Yellow Sea in early summer[J]. Oceanology et Limnologia Sinica, 2016, 47(4): 755-763. |
| [11] |
WANG F, LI X, TANG X, et al. The seas around China in a warming climate[J]. Nature Review Earth & Environment, 2023, 4: 535-551. |
| [12] |
傅明珠, 王宗灵, 李艳, 等. 胶州湾浮游植物初级生产力粒级结构及固碳能力研究[J]. 海洋科学进展, 2009, 27(3): 357-366. FU Mingzhu, WANG Zongling, LI Yan, et al. Study on size-fraction and carbon fixation of phytoplankton primary productivity in Jiaozhou Bay[J]. Advances in Marine Science, 2009, 27(3): 357-366. |
| [13] |
GUO S, ZHAO Z, LIANG J, et al. Carbon biomass, carbon-to-chlorophyll a ratio and the growth rate of phytoplankton in Jiaozhou Bay, China[J]. Journal of Oceanology Limnology, 2021, 39(4): 1328-1342. DOI:10.1007/s00343-020-0234-z |
| [14] |
MULLIN M M, SLOAN P R, EPPLEY R W. Relationship between carbon content, cell volume and area in phytoplankton[J]. Limnology and Oceanography, 1966, 11(2): 307-311. DOI:10.4319/lo.1966.11.2.0307 |
| [15] |
EPPLEY R W, REID F M H, STRICKLAND J D H. Estimates of phytoplankton crop size, growth rate, and primary production[J]. Bulletin of the Scripps Institution of Oceanography of the university of California, 1970, 17: 33-42. |
| [16] |
VERITY P G, ROBERTSON C Y, TRONZO C R, et al. Relationships between cell volume and the carbon and nitrogen content of marine photosynthetic nanoplankton[J]. Limnology and Oceanography, 1992, 37(7): 1434-1446. DOI:10.4319/lo.1992.37.7.1434 |
| [17] |
MONTAGNES D J S, BERGES J A, HARRISON P J, et al. Estimating carbon, nitrogen, protein, and chlorophyll a from volume in marine phytoplankton[J]. Limnology and Oceanography, 1994, 39(5): 1044-1060. DOI:10.4319/lo.1994.39.5.1044 |
| [18] |
MENDEN-DEUER S, LESSARD E J. Carbon to volume relationships for dinoflagellates, diatoms, and other protist plankton[J]. Limnology and Oceanography, 2000, 45(3): 569-579. DOI:10.4319/lo.2000.45.3.0569 |
| [19] |
YANG Y, SUN X X, ZHU M L, et al. Estimating the carbon biomass of marine net-phytoplankton from abundance based on samples from China seas[J]. Marine and Freshwater Research, 2016, 68(1): 106-115. DOI:10.1071/MF15298 |
| [20] |
WANG W, SUN S, SUN X, et al. Spatial patterns of zooplankton size structure in relation to environmental factors in Jiaozhou Bay, South Yellow Sea[J]. Marine Pollution Bulletin, 2020, 150: 110698. DOI:10.1016/j.marpolbul.2019.110698 |
| [21] |
ÁLVAREZ E, LÓPEZ-URRUTIA Á, NOGUEIRA E, et al. How to effectively sample the plankton size spectrum? A case study using FlowCAM[J]. Journal of Plankton Research, 2011, 33(7): 1119-1133. DOI:10.1093/plankt/fbr012 |
| [22] |
SPAULDING S A, JEWSON D H, BIXBY R J, et al. Automated measurement of diatom size[J]. Limnology and Oceanography: Methods, 2012, 10(11): 882-890. DOI:10.4319/lom.2012.10.882 |
| [23] |
KRAUS C N, BONNET M P, DE SOUZA NOGUEIRA I, et al. Unraveling flooding dynamics and nutrients' controls upon phytoplankton functional dynamics in Amazonian floodplain lakes[J]. Water, 2019, 11(1): 154. DOI:10.3390/w11010154 |
| [24] |
ZHANG L, XIONG L, LI J, et al. Long-term changes of nutrients and biocenoses indicating the anthropogenic influences on ecosystem in Jiaozhou Bay and Daya Bay, China[J]. Marine Pollution Bulletin, 2021, 168: 112406. DOI:10.1016/j.marpolbul.2021.112406 |
| [25] |
BRAND L E, GUILLARD R R L. The effects of continuous light and light intensity on the reproduction rates of twenty-two species of marine phytoplankton[J]. Journal of Experimental Marine Biology and Ecology, 1981, 50(2/3): 119-132. |
| [26] |
MALONE T C, CONLEY D J, FISHER T R, et al. Scales of nutrient-limited phytoplankton productivity in Chesapeake Bay[J]. Estuaries, 1996, 19: 371-385. DOI:10.2307/1352457 |
| [27] |
张立明, 谭烨辉, 李佳俊, 等. 大亚湾夏季浮游植物群落结构及对淡澳河输入的响应特征[J]. 热带海洋学报, 2020, 39(5): 43-54. ZHANG Liming, TAN Yehui, LI Jiajun, et al. Characteristics of the phytoplankton community and its response to Dan'ao River input in Daya Bay in summer[J]. Journal of Tropical Oceanography, 2020, 39(5): 43-54. |
| [28] |
CARMACK E C, MACDONALD R W, JASPER S. Phytoplankton productivity on the Canadian Shelf of the Beaufort Sea[J]. Marine Ecology Progress Series, 2004, 277: 37-50. DOI:10.3354/meps277037 |
| [29] |
ZHOU Q, DONG X, WANG J, et al. Critical factors driving spatiotemporal variability in the phytoplankton community structure of the coral habitat in Dongshan Bay, China[J]. Frontiers in Microbiology, 2024, 15: 1355028. DOI:10.3389/fmicb.2024.1355028 |
| [30] |
HELLIWELL K E, HARRISON E L, CHRISTIE-OLEZA J A, et al. A novel Ca2+ signaling pathway coordinates environmental phosphorus sensing and nitrogen metabolism in marine diatoms[J]. Current Biology, 2021, 31(5): 978-989. DOI:10.1016/j.cub.2020.11.073 |
| [31] |
WEI Y, LUAN Q, SHAN X, et al. Temperature and nutrients drive distinct successions between diatoms and dinoflagellates over the past 40 years: Implications for climate warming and eutrophication[J]. Science of the Total Environment, 2024, 931: 172997. DOI:10.1016/j.scitotenv.2024.172997 |