 2025, Vol. 49
文章信息
- 刘雨筠, 罗逸飞, 史洁, 郭新宇. 2025.
- LIU Yujun, LUO Yifei, SHI Jie, GUO Xinyu. 2025.
- 黄-东海界面水通量和溶解无机氮交换通量的年际变化
- Interannual variations in water volume and dissolved inorganic nitrogen exchange fluxes across the boundary between the Yellow Sea and the East China Sea
- 海洋科学, 49(8): 11-21
- Marine Sciences, 49(8): 11-21.
- http://dx.doi.org/10.11759/hykx20240930001
-
文章历史
- 收稿日期:2024-09-30
- 修回日期:2024-11-06


2. 爱媛大学沿岸环境研究中心, 日本 松山 790-8577
2. Center for Marine Environmental Studies, Ehime University, Matsuyama 790-8577, Japan
黄海是半封闭的陆架海, 其海洋生态环境受大陆气候以及人类活动影响显著[1, 2]。东海是西北太平洋最重要的边缘海之一, 其生态系统的营养盐状态受黑潮、长江输入等众多动力过程的影响[3]。黄-东海界面西起长江口的启东嘴, 东至济州岛的西南, 宽度约502 km, 是黄、东海的地理分界线, 也是黄海和东海水和物质交换的重要通道。因人类活动以及气候变化等造成的黄、东海生态系统的时空变化, 可以通过黄-东海界面进行传递, 从而相互产生复杂的影响。因此, 研究黄-东海界面水通量和营养盐交换通量的时空变化对于理解黄东海的营养盐收支循环和初级生产过程具有重要意义。
目前对于黄东海之间水通量和营养盐通量的研究主要集中在年尺度以及季节尺度上, 而年际尺度的研究较为缺乏。对于水通量, Liu等[4]使用箱式模型估算年均值为0.21 Sv(1 Sv=106 m3/s), Teague等[5]利用质量平衡估算年均值为0.56 Sv。数值模拟是海洋研究的重要手段, 齐继峰等[3]和Liu等[6]使用数值模拟得到了黄-东海界面水通量夏强冬弱的季节变化特征。根据水交换量和界面处营养盐浓度可以计算出黄东海营养盐交换量, Liu等[4]估算黄东海NO3–交换量为0.65×10⁶ mmol/s, 赵晨英等[7]估算溶解无机氮(dissolved inorganic nitrogen, DIN)通量为0.41×10⁶ mmol/s。蒋昊等[8]通过数值模拟计算黄东海年均DIN交换通量为0.98×106 mmol/s。Liu等[6]使用数值模拟计算出黄-东海界面DIN通量同样具有夏强冬弱的季节变化特征, 并且其季节变化主要受海流的季节变化控制。
然而, 黄-东海界面存在的海洋动力过程, 如长江冲淡水、黄海暖流等, 既有季节变化又有显著的年际差异。长江冲淡水在夏季风的驱动下向东北方向扩展, 由黄-东海界面西部进入黄海[9]。研究表明, 冲淡水向东扩展范围主要在123°~126°E, 其扩展形态和扩展面积都有显著的年际变化[10]。长江径流量对冲淡水向外海扩展的距离影响较大, 而向东北方向的淡水通量的与东南风关系密切[10-11]。济州暖流由黄-东海界面东部进入黄海后绕济州岛顺时针流动, 随后由济州海峡流出黄海。在冬季黄海暖流从济州暖流中分离, 向西南方向深入黄海内部, 对黄海的生态环境产生影响[12, 13]。研究表明黄海暖流强弱存在4~7 a的变化周期, 可能受厄尔尼诺-南方涛动事件的影响, 受拉尼娜事件的影响更明显[14-15]。
同时, 黄海和东海的营养盐状态和生态环境年际变化显著。从20世纪末到2010年前后, 由于黄海周边经济发展迅速, 入海排污量大, 黄海生态灾害频繁发生[16-18]。2010年后, 由于人为排放以及陆源输入营养物质减少, 黄海DIN、溶解无机磷(dissolve inorganic phosphorus, DIP)等营养盐浓度开始减小[19], 浮游植物生物量呈下降趋势[20, 21], 赤潮覆盖面积和发生次数也在减小[22]。对于东海陆架来说, 1993—2014年, 外海大洋向东海陆架输送硝酸盐通量增加[23], 其DIN、DIP浓度和N/P呈明显的上升趋势[24]。长江输入是东海重要的营养盐来源, 1980—2000年, 长江输入的DIN和DIP通量呈现明显的上升趋势, 2000年之后基本维持在高值并上下浮动[25]。长江口附近海域叶绿素a浓度和浮游植物生物量呈现明显的上升趋势, 并且该海区的赤潮和有害藻华发生的频次和规模都急剧增加[26]。然而, 黄海和东海动力过程以及生态环境的年际变化, 必然导致黄-东海界面水通量和营养盐交换通量的年际变化, 但目前相关研究较为缺乏。
黄-东海界面地理跨度较大, 难以获取高时空分辨率的观测资料, 仅凭现有的观测数据不足以建立黄-东海界面营养盐交换通量完整的时空四维结构。因此, 本研究拟使用三维动力-生态耦合海洋模式, 以DIN为例, 定量计算黄-东海界面处水通量和DIN交换通量, 分析其空间分布和年际变化特征, 并揭示年际变化的影响因素。
1 方法 1.1 模型介绍本文使用的三维动力-生态耦合模型由动力模块和生态模块组成[27-28]。动力模块基于普林斯顿海洋模型(POM), 并为生态模块计算提供水位、温度、流场和扩散系数。生态模块基于NORWECOM的生态部分, 包含的状态变量分别是3种无机营养盐: DIN、DIP、硅酸盐; 两种藻类: 硅藻、甲藻; 两种碎屑: 氮磷碎屑和生物硅。该模型曾用来模拟和分析黑潮和东海环流模式的季节变化[29-30], 东海营养盐和叶绿素浓度分布的季节变化[27, 31]和年际变化[28], 说明模型可以成功再现中国东海物理及生态环境的季节和年际变化特征。
1.2 模型配置和数据来源模型的模拟区域为(117°30′~131°30′E, 24°~41°N), 包含了渤海、黄海、东海以及部分的日本海。模型水平分辨率为(1/18)°(约6 km), 共计254×308个网格。垂向上包含21个sigma层。
模型动力部分初始条件来自Wang等[31]的气候态一月的模拟结果, 生态部分营养盐浓度初始场来自World Ocean Atlas 2005(WOA 2005, https://www.ncei.noaa.gov/products/world-ocean-atlas)。动力模块的大气强迫数据来自欧洲中尺度天气预报中心(ECMWF)的ERA-interim再分析数据集, 包括风、海平面气压、蒸发、降水、热通量和海表温度。风应力数据采样间隔为6 h, 其余大气强迫为日平均。月平均长江径流量数据来自中华人民共和国水利部公布的《中国河流泥沙公报》(http://www.mwr.gov.cn/sj/)。开边界条件来自日本近海可预测性实验(JCOPE2) (https://www.jamstec.go.jp/jcope/htdocs/e/distribution/index.html)数据集, 包括水位、水温、盐度和流速。潮汐数据来自日本国立天文台NAO.99b全球潮汐模式(https://www.miz.nao.ac.jp/staffs/nao99/index_En.html)。模型生态部分使用的渤、黄、东海的大气干、湿沉降营养盐数据来自多篇文献[32-36]。长江营养盐浓度来自Zhang[37]的观测。开边界营养盐浓度来自WOA 2005。南边界处, 台湾海峡和台湾东部营养盐浓度来自日本气象厅(JMA)以及Chen等[38]的实测数据。Wang等[39]提供了东海表层悬浮体浓度数据。用于验证模型对马海峡水通量年际变化模拟结果的观测资料来自Shin等[40]和Zheng等[41]。
模型在2010年的强迫条件下重复积分3 a, 达到稳定后, 从2010年1月1日至2018年12月31日连续运行9 a。本研究基于2010—2018年的模拟结果进行分析。
1.3 水通量和营养盐通量的计算方法本文选取长江口A站(121°49′E, 31°55′N)至济州岛西南B站(126°09′E, 33°19′N)之间的连线作为黄-东海界面, 该界面与正东方向夹角θ=17°30′。正值代表流入黄海方向, 水通量(V: m3/s)和DIN通量(F: mmol/s)按如下方程计算:
| $ V = \iint {u{\text{d}}y{\text{d}}z} + \iint {v{\text{d}}x{\text{d}}z}, $ | (1) |
| $ F = \iint {u \cdot C{\text{d}}y{\text{d}}z} + \iint {v \cdot C{\text{d}}x{\text{d}}z}, $ | (2) |
其中u为东西方向流速(m/s), v为南北方向流速(m/s), dx为纬向网格长度(m), dy为经向网格长度(m), dz为sigma层水深(m), C为DIN物质的量浓度(下文简称DIN浓度, 单位mmol/m3)。
1.4 模型验证以往研究已经对该模型模拟的黄东海多个断面水通量的季节变化[6]以及营养盐浓度的季节变化[6, 8, 31]和年际变化[28]结果进行了验证, 结果均表明模型可以较好再现出黄、东海物理场和生态场的时空变化。
本文选取观测数据较多的对马海峡(128°30′~ 129°43′E, 33°30′~34°42′N)进行验证。将2010—2018年对马海峡处水通量的模拟结果与观测进行对比(图 1), 其中2012—2014年的观测数据来自Zheng等[41], 其余年份来自Shin等[40]。从模拟结果看, 9 a间对马海峡水通量均值为2.69 Sv, 标准差为0.08 Sv, 2010—2015年水通量较小, 2016—2018年略有增加。其中2014年水通量最小, 为2.61 Sv; 2018年最大, 为2.83 Sv。模型模拟结果与观测结果具有相似的年际变化特征, 并且量值相当。通过相关性分析可得, 观测结果与模拟结果水通量时间序列的相关系数为0.89, 表明模型较好地再现了对马海峡水通量的年际变化特征, 模拟结果可靠。
 |
| 图 1 对马海峡水通量模拟结果与观测结果 Fig. 1 Modeled and observed results of volume transport across the Tsushima Strait |
基于模拟结果, 计算得到黄-东海界面2010— 2018年逐月以及年均水通量的时间序列(图 2)。由水通量的逐月变化可以看出9 a内水通量均为正值, 表示流入黄海。水通量季节变化较为显著, 均呈现“夏强冬弱”的季节变化特征。夏季的长江冲淡水向东北方向扩展、台湾暖流增强以及济州暖流流入黄海共同导致界面夏季水通量增大; 而冬季的偏北风使界面上层海水整体流出黄海, 造成了界面冬季净水通量较小[6]。以2010年为例, 水通量最小值出现在2月, 为0.19 Sv; 最大值出现在8月, 为0.50 Sv。
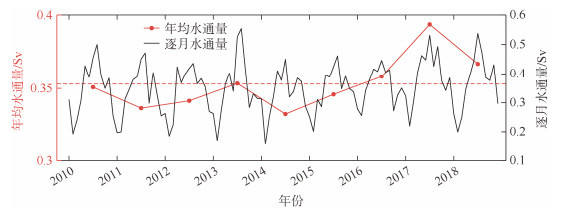 |
| 图 2 黄-东海界面水通量的时间序列 Fig. 2 Time series of water volume transport across the boundary between Yellow Sea and the East China Sea Section 注: 红色虚线代表 9 a平均水通量 |
黄-东海界面9 a内水通量的均值为0.35 Sv, 逐月时间序列的标准差为0.09 Sv, 年均水通量时间序列的标准差为0.02 Sv。由年均水通量的年际变化可以看出, 2010—2015年年平均水通量小于平均值, 最小值出现在2014年, 为0.33 Sv; 2016—2018年年平均水通量大于平均值, 最大值出现在2017年, 为0.39 Sv。
济州暖流在黄-东海界面东部126°E附近, 从济州岛西南流入黄海再由济州海峡(126°32′E, 33°32′~ 34°22′N)流出黄海, 其水通量在夏秋季较大而冬春季较小[42]。基于模型结果, 济州海峡作为黄海海水的出口, 其9 a内水通量均值为–0.36 Sv。济州暖流的强度与黑潮入侵陆架强度有关[43], 罗逸飞[44]计算表明2014年黑潮入侵强度较弱, 而2017年黑潮入侵强度较强。因此, 黑潮入侵强度可能通过影响济州暖流强弱, 导致了黄-东海界面水通量2014年和2017年最值的出现。
2.2 黄-东海界面DIN通量的年际变化黄-东海界面2010—2018年DIN平均浓度逐月和年均时间序列如图 3(a)所示。界面9年间DIN平均浓度的均值为8.80 mmol/m3, DIN浓度的逐月时间序列的标准差为0.75 mmol/m3, 年均值时间序列的标准差为0.55 mmol/m3。界面DIN浓度在2010、2015和2016年DIN浓度大于平均值, 其余年份的DIN浓度则小于平均值。最大值出现在2016年, 为9.51 mmol/m3, 最小值在2011年, 为8.12 mmol/m3。
 |
| 图 3 黄-东海界面DIN平均浓度(a)和DIN通量(b)的时间序列 Fig. 3 Time series of mean DIN concentration (a) and DIN flux (b) across the boundary between Yellow Sea and the East China Sea Section |
图 3(b)为2010—2018年黄-东海界面DIN通量逐月和年均时间序列。DIN通量整体呈东海流入黄海方向, 9 a内DIN通量的平均值为2.71×10⁶ mmol/s。济州海峡多年DIN通量的均值为–1.91 ×106 mmol/s, 因此, 由黄海南边界进入黄海的DIN通量为0.60×10⁶ mmol/s, 该值与前人研究结果较相符[4, 7]。逐月DIN通量的时间序列标准差为1.15×10⁶ mmol/s, 与平均值量级相同, 说明其季节变化显著; 年均DIN通量时间序列标准差为0.24×10⁶ mmol/s, 约为平均值的10%, 表明其年际变化较季节变化小。DIN通量各年季节变化均表现为明显的“夏强冬弱”特征, 与水通量季节变化一致, 说明DIN通量的季节变化主要受水通量的影响。以2010年为例, DIN通量的最小值出现在12月, 为0.20×10⁶ mmol/s; 最大值出现在8月, 为4.77×10⁶ mmol/s, 比最小值大一个数量级。
年际变化上可以看出, 2011—2014年DIN通量的年均值小于9 a平均值, 2010和2015—2018年年均值大于多年平均值。DIN通量年均值的最大值出现在2017年, 为3.06×10⁶ mmol/s, 该年水通量也达最大; 而最小值出现在2011年, 为2.35×10⁶ mmol/s, 这是由于该年DIN浓度最低同时该年水通量也小于多年均值。
2.3 黄-东海界面DIN通量空间分布的年际变化图 4为黄-东海界面2010—2018年平均DIN通量的空间分布。以东海流入黄海为正方向, DIN的出流区面积以及通量的绝对值均小于入流区。DIN出流区集中在界面的中部上层水深小于40 m海域, DIN通量值随着深度的增加而降低, 这主要与秋冬季强烈的北风有关[6]。其中出流区的DIN通量高值出现在界面124.3°E表层, 达到了–0.3 mmol·m–2·s–1。界面上其他海域为DIN的入流区, 最强入流在在122°E长江口附近海域, 超过了1 mmol·m–2·s–1。在122°~123°E, 10 m以上的海域, 也出现明显DIN流入的高值, 达到了0.3 mmol·m–2·s–1, 这与长江冲淡水的扩展有关[6]。在界面东部深水区, 125°E以东, 60 m以深的海域, DIN的流入量较大, 超过0.3 mmol·m–2·s–1, 这与济州暖流以及深层高DIN浓度有关[6]。值得注意的是, 黄海暖流是济州暖流在冬季向西南方向的分支, 而对于本研究黄-东海界面所选位置而言, 济州暖流和黄海暖流作用范围相同。
 |
| 图 4 黄-东海界面9 a平均DIN通量的空间分布 Fig. 4 Spatial distribution of the 9-year average DIN flux across the boundary between Yellow Sea and the East China Sea Section |
图 5为黄-东海界面2010—2018年DIN通量距平的空间分布。根据界面DIN通量多年平均的空间分布, 我们主要关注界面3个典型区域, 即界面123°E以西, 10 m以上的长江冲淡水控制区; 界面123.5°~125.5°E, 40 m以上的季风控制区; 界面125°E以东, 60 m以深的济州暖流区。长江冲淡水控制区DIN流入黄海, 在界面中DIN通量距平值最大, 表明该区域是界面中DIN通量年际变化最强的水域。该区域DIN通量距平值在2011年和2013—2015年为负值, 其中在2011年距平值最小, 达到–1 mmol·m–2·s–1。表明在这些年份中, DIN流入量较小, 其中2011年该海域的DIN流入量在9 a内最小。其余年份DIN通量距平值为正值, 其中2010、2012和2017年距平值较大, 达到1 mmol·m–2·s–1。这表明这3年该区域DIN流入量较大。在季风区DIN流出黄海, 2010年和2015年该区域DIN通量距平大面积为负值, 表明DIN流出量较大, 而2012和2018年该区域DIN通量距平大面积为正值, 表明DIN流出量小。济州暖流区为DIN流入黄海区, 在2010—2014年该区域DIN通量的距平为负, 其中2011年DIN通量的距平值最小, 部分水域达到–1 mmol·m–2·s–1; 在2015—2018年该区域DIN通量值为正。这表明2010— 2014年该区域DIN流入量低于9 a平均值, 其中在2011年最小, 而在2015—2018年, DIN流入量高于9 a均值, DIN流入量较大。
 |
| 图 5 黄-东海界面2010—2018年各年DIN通量距平的空间分布 Fig. 5 Spatial distribution of DIN flux anomaly across the boundary between Yellow Sea and the East China Sea Section from 2010 to 2018 |
分别对黄-东海界面逐月DIN通量距平的时间序列、水通量、界面DIN平均浓度的距平时间序列进行相关性分析。结果显示, DIN通量距平的逐月时间序列与水通量距平的时间序列显著正相关, 相关性系数为0.78; 与DIN平均浓度距平的时间序列相关性较弱, 也表现为正相关, 相关性系数为0.32, 以上相关性分析均通过99%的置信检验。相关性分析表明DIN通量的年际变化受水通量年际变化影响显著, 受DIN浓度影响较弱。
为了进一步讨论黄-东海界面上水通量和DIN浓度在不同区域对DIN通量年际变化的影响, 采用多因素方差分析对黄东海界面DIN通量方差进行分解, 并分析方差分解后的6项[45]。
DIN通量(
其中, N代表 9 a间总月数(108)。因此, DIN通量可以表示为
| $ {F_i} = \overline{V} \overline{C} + \overline{V} {C'_i} + {V'_i}\overline{C} + {V'_i}\;{C'_i} . $ | (3) |
DIN通量的时间平均值(
| $ \overline{F} = \overline{V} \overline{C} + \frac{1}{N}\sum\limits_{i = 1}^N {{{V'}_i}\;{{C'}_i}} . $ | (4) |
引入一个新变量
代入等式(4), 得到
| $ \overline{F} = \overline{V} \overline{C} + \overline{G} . $ | (5) |
将DIN通量的方差(
| $ \sigma _F^2 = \frac{1}{N}\sum\limits_{i = 1}^N {{{({F_i} - \overline{F} )}^2}} . $ | (6) |
将等式(3)和等式(5)带入等式(6), 可以得到
| $ \begin{gathered} \sigma _F^2 = {\overline{C} ^2}\sigma _V^2 + {\overline{V} ^2}\sigma _C^2 + 2\overline{C} \overline{V} \sigma _{CV}^2 \\ \; + 2\overline{C} \sigma _{VG}^2 + 2\overline{V} \sigma _{CG}^2 + \sigma _G^2 \\ \end{gathered} , $ | (7) |
其中
根据等式(7), DIN通量的方差可以分解成6项, 其中
 |
| 图 6 黄-东海界面DIN通量方差(a)及其6个分解项(b—g)的分布 Fig. 6 Distribution of the variance of the DIN flux (a) and its six decomposed terms (b–g) across the boundary between Yellow Sea and the East China Sea Section |
对于方差分解后的6项, 在界面大部分海域速度方差项
图 7为黄-东海界面2010—2018年冬季的DIN通量、水通量和DIN浓度的年际变化。从图中可以看出, 三者在冬季年际变化趋势相近。DIN通量在2010年较大, 随后开始减小, 到2014年达到最小值(1.38×10⁶ mmol/s)后呈现上升趋势, 到2016年达到最大(2.99×10⁶ mmol/s)后减小。水通量同样在2014年达到最小值, 为0.16 Sv; 在2016年达到最大值, 为0.26 Sv。DIN浓度在2011年出现最大值, 为8.39 mmol/m3, 同样在2016年出现最大值, 为9.99 mmol/m3。将DIN通量的时间序列分别与水通量和DIN浓度的时间序列进行相关性分析, 得到相关性系数分别为0.83和0.88。这说明冬季DIN通量的年际变化与水通量和DIN浓度均显著相关, 表明冬季DIN交换通量由水通量和DIN浓度共同调控。
 |
| 图 7 2010—2018年冬季(2月)黄-东海界面DIN平均浓度、水通量和DIN交换通量的时间序列 Fig. 7 Time series of DIN concentration, water volume transport, and DIN flux across the boundary between Yellow Sea and the East China Sea Section during winter (February) from 2010 to 2018. |
图 8是2010—2018年黄-东海界面夏季DIN通量、水通量和DIN浓度的时间序列。夏季水通量和DIN通量明显高于冬季。DIN通量在2010年达到最大值, 为4.77×10⁶ mmol/s; 在2014年达到最小值, 为2.44×10⁶ mmol/s, 约为最大值的一半。水通量的年际变化与DIN通量相似, 最大值出现在2013年, 为0.55 Sv; 最小值同样出现在2014年, 为0.32 Sv。DIN浓度的年际变化与DIN通量不同, 最大值出现在2010年, 为10.14 mmol/m3; 最小值出现在2013年, 8.57 mmol/m3。将DIN通量的时间序列分别与水通量和DIN浓度进行相关性分析, 得到相关性系数分别为0.73和0.46。这表明DIN通量和水通量相关性较强, 与DIN浓度相关性较弱, 进一步说明夏季DIN通量的年际变化主要受水通量影响, 受DIN浓度影响较小。
 |
| 图 8 2010—2018年夏季(8月)黄-东海界面DIN平均浓度、水通量和DIN交换通量的时间序列 Fig. 8 Time series of DIN concentration, water volume transport, and DIN flux across the boundary between Yellow Sea and the East China Sea Section during summer (August) from 2010 to 2018 |
本文基于三维动力-生态耦合模式给出黄、东海2010—2018年物理场和生态场的模拟结果, 定量计算了黄-东海界面水通量和DIN交换通量, 揭示了水通量和DIN交换通量的空间分布和年际变化规律, 最后对DIN交换通量空间分布年际变化的影响因素以及冬、夏季DIN通量年际变化的影响因素展开讨论, 主要结论如下:
(1) 黄-东海界面水通量流入黄海, 多年平均值为0.35 Sv, 逐月水通量标准差为0.09 Sv, 年均水通量标准差为0.02 Sv。年均水通量最大值在2017年, 为0.40 Sv, 最小值在2014年, 为0.34 Sv。黄-东海界面水通量的年际变化可能与黑潮入侵强度的年际变化有关。
(2) DIN通量多年平均值为2.71×10⁶ mmol/s, 逐月DIN通量标准差为1.15×10⁶ mmol/s, 年均DIN通量标准差为0.24×10⁶ mmol/s, 表明其年际变化较季节变化小。DIN通量的最大值出现在水通量最大的2017年, 为3.19×10⁶ mmol/s, 最小值出现在DIN浓度最小的2011年, 为2.39×10⁶ mmol/s。
(3) 在黄-东海界面上DIN通量以入流为主, 出流区集中在界面中部上层。界面长江冲淡水控制区DIN通量年际变化最强, 该区域2011年DIN流入量最小, 2010年DIN流入量最大。季风控制区DIN流出黄海, 2010和2015年DIN流出量较大, 2012和2018年DIN流出量较小。济州暖流区DIN流入量在2014年之前较小, 而2014年之后开始增大。
(4) DIN交换通量的年际变化与水通量的相关性较大, 与DIN浓度的相关性较小, 表明DIN通量的年际变化主要受水通量年际变化控制。在黄-东海界面上, 西部表层水域和东部底层水域DIN通量年际变化较为显著。其中西部表层水域DIN通量年际变化与长江输入DIN通量年际变化关系密切且主要受流速年际变化控制; 东部底层水域DIN通量年际变化受到流速和DIN浓度年际变化共同调控。
(5) 冬季与夏季DIN交换通量年际变化的控制因子不同, 冬季受水通量和DIN浓度年际变化共同调控, 而夏季主要受水通量年际变化控制。
| [1] |
乌伊寒, 张晶, 赵亮, 等. 黄海氮磷营养盐时空特征及影响过程分析[J]. 天津科技大学学报, 2021, 36(5): 30-40. WU Yihan, ZHANG Jing, ZHAO Liang, et al. Spatiotemporal characteristics of nitrogen and phosphorus and its influencing processes in the Yellow Sea[J]. Journal of Tianjin University of Science and Technology, 2021, 36(5): 30-40. |
| [2] |
刘军, 臧家业, 张丽君, 等. 黄海硅的分布与收支研究[J]. 中国环境科学, 2016(1): 157-166. LIU Jun, ZANG Jiaye, ZHANG Lijun, et al. Distribution, fluxes and budget of silicon in the Yellow Sea[J]. China Environmental Science, 2016(1): 157-166. |
| [3] |
齐继峰, 尹宝树, 张启龙, 等. 东海与邻近海域水、热、盐通量的季节变化研究[J]. 海洋学报, 2016, 38(11): 1-19. QI Jifeng, YIN Baoshu, ZHANG Qilong, et al. Seasonal variation of the volume, heat and salt transport in the East China Sea and adjacent regions[J]. Haiyang Xuebao, 2016, 38(11): 1-19. |
| [4] |
LIU S M, ZHANG J, CHEN S Z, et al. Inventory of nutrient compounds in the Yellow Sea[J]. Continental Shelf Research, 2003, 23(11/13): 1161-1174. |
| [5] |
TEAGUE W J, JACOBS G A, KO D S, et al. Connectivity of the Taiwan, Cheju, and Korea straits[J]. Continental Shelf Research, 2003, 23(1): 63-77. DOI:10.1016/S0278-4343(02)00150-4 |
| [6] |
LIU Y, MAO X, SHI J, et al. Seasonal and spatial variations of dissolved inorganic nitrogen exchange between the Yellow Sea and the East China Sea and the influencing factors[J]. Marine Pollution Bulletin, 2024, 208: 116992. DOI:10.1016/j.marpolbul.2024.116992 |
| [7] |
赵晨英, 臧家业, 刘军, 等. 黄渤海氮磷营养盐的分布、收支与生态环境效应[J]. 中国环境科学, 2016, 36(7): 2115-2127. ZHAO Chenying, ZANG Jiaye, LIU Jun, et al. Distribution and budget of nitrogen and phosphorus and their influence on the ecosystem in the Bohai Sea and Yellow Sea[J]. China Environmental Science, 2016, 36(7): 2115-2127. |
| [8] |
蒋昊, 赵亮, 张晶. 黄海溶解无机氮及颗粒有机氮收支与转化模型[J]. 中国环境科学, 2020, 40(9): 3981-3991. JIANG Hao, ZHAO Liang, ZHANG Jing. Budgets and transformation of dissolved inorganic and particulate organic nitrogen in the Yellow Sea: A model study[J]. China Environmental Science, 2020, 40(9): 3981-3991. |
| [9] |
HOU W, BA M, BAI J, et al. Numerical study on the expansion and variation of Changjiang Diluted Water in summer and autumn[J]. Journal of Marine Science and Engineering, 2021, 9(3): 317. DOI:10.3390/jmse9030317 |
| [10] |
胡静雯, 王其翔, 郭志谦, 等. 基于遥感数据的夏季长江冲淡水年际间扩展规律及其影响因素[J]. 空间科学学报, 2023, 43(6): 1069-1080. HU Jingwen, WANG Qixiang, GUO Zhiqian, et al. Analysing interannual variation of Changjiang Diluted Water spreading and its influencing factors based on remote sensing observations[J]. Chinese Journal of Space Science, 2023, 43(6): 1069-1080. |
| [11] |
郭亚茹, 荣增瑞, 迟玉涛, 等. 夏季长江冲淡水年际变化的数值研究[J]. 海洋湖沼通报, 2020(4): 30-41. GUO Yaru, RONG Zengrui, CHI Yutao, et al. The modeling study of interannual variability of Changjiang River plume in summer season[J]. Transactions of Oceanology and Limnology, 2020(4): 30-41. |
| [12] |
LIN X, YANG J, GUO J, et al. An asymmetric upwind flow, Yellow Sea Warm Current: 1. New observations in the western Yellow Sea[J]. Journal of Geophysical Research: Oceans, 2011, 116: C04026. |
| [13] |
XU L, WU D, LIN X, et al. The study of the Yellow Sea Warm Current and its seasonal variability[J]. Journal of Hydrodynamics, 2009, 21(2): 159-165. DOI:10.1016/S1001-6058(08)60133-X |
| [14] |
曹友华, 朱乾坤. 基于Aqua/MODIS数据研究黄海暖流的强度及其时空变化[J]. 海洋预报, 2021, 38(6): 93-102. CAO Youhua, ZHU Qiankun. Study on the intensity and temporal and spatial variation of Yellow Sea Warm Current based on Aqua/MODIS data[J]. Marine Forecasts, 2021, 38(6): 93-102. |
| [15] |
赵胜, 于非, 刁新源, 等. 黄海暖流的路径及机制研究[J]. 海洋科学, 2011, 35(11): 73-80. ZHAO Sheng, YU Fei, DIAO Xinyuan, et al. The path and mechanism of the Yellow Sea Warm Current[J]. Marine Sciences, 2011, 35(11): 73-80. |
| [16] |
XIA B, MA S S, CUI Y, et al. Distribution of temperature, salinity, dissolved oxygen, nutrients and their relationships with green tide in Enteromorpha prolifera outbreak area of the Yellow Sea[J]. Progress in Fishery Sciences, 2009, 30: 94-101. |
| [17] |
王婷, 石晓勇, 张传松, 等. 2008年黄海浒苔绿潮爆发区营养盐浓度变化及分布特征[J]. 海洋通报, 2011, 30(5): 578-582. WANG Ting, SHI Xiaoyong, ZHANG Chuansong, et al. Variations in nutrient concentration and distribution for green tide of Enteromorpha prolifera occurrence areas of the Yellow Sea in 2008[J]. Marine Science Bulletin, 2011, 30(5): 578-582. |
| [18] |
LI H, ZHANG C, HAN X, et al. In concentrations of oxygen, dissolved nitrogen, phosphate, and silicate in the southern Yellow Sea, 1980–2012: Sources and seaward gradients[J]. Estuarine, Coastal and Shelf Science, 2015, 163: 44-55. |
| [19] |
CHEN X, WEI Q, JIAN H, et al. Long-term variation in nutrients in the South Yellow Sea in response to anthropogenic inputs[J]. Marine Pollution Bulletin, 2023, 192: 115039. DOI:10.1016/j.marpolbul.2023.115039 |
| [20] |
LIU X, CHIANG K, LIU S, et al. Influence of the Yellow Sea Warm Current on phytoplankton community in the central Yellow Sea[J]. Deep Sea Research Part Ⅰ: Oceanographic Research Papers, 2015, 106: 17-29. DOI:10.1016/j.dsr.2015.09.008 |
| [21] |
ZHAI F, LIU Z, GU Y, et al. Satellite‐observed interannual variations in sea surface chlorophyll‐a concentration in the Yellow Sea over the past two decades[J]. Journal of Geophysical Research: Oceans, 2023, 128: e2022JC019528. DOI:10.1029/2022JC019528 |
| [22] |
李志文, 左秀玲, 滕君灿. 基于GIS的中国近岸海域1950—2020年赤潮时空变异格局[J]. 环境科学学报, 2023, 43(6): 203-214. LI Zhiwen, ZUO Xiuling, TENG Juncan. GIS-based temporal and spatial patterns of red tides in the coastal waters of China from 1950 to 2020[J]. Acta Scientiae Circumstantiae, 2023, 43(6): 203-214. |
| [23] |
DING R, HUANG D, XUAN J, et al. Temporal and spatial variations of cross‐shelf nutrient exchange in the East China Sea, as estimated by satellite altimetry and in situ measurements[J]. Journal of Geophysical Research: Oceans, 2019, 124(2): 1331-1356. DOI:10.1029/2018JC014496 |
| [24] |
YE L A, ZHANG H B, FEI Y J, et al. Nutrient Distributions in the East China Sea and Changes Over the Last 25 Years[J]. Applied Ecology and Environmental Research, 2020, 18(1): 973-985. DOI:10.15666/aeer/1801_973985 |
| [25] |
WU W, WANG J, WANG H, et al. Trends in nutrients in the Changjiang River[J]. Science of The Total Environment, 2023, 872: 162268. DOI:10.1016/j.scitotenv.2023.162268 |
| [26] |
KONG C E, YOO S, JANG C J. East China Sea ecosystem under multiple stressors: Heterogeneous responses in the sea surface chlorophyll-a[J]. Deep Sea Research Part Ⅰ: Oceanographic Research Papers, 2019, 151: 103078. DOI:10.1016/j.dsr.2019.103078 |
| [27] |
ZHAO L, GUO X. Influence of cross-shelf water transport on nutrients and phytoplankton in the East China Sea: a model study[J]. Ocean Science, 2011, 7(1): 27-43. DOI:10.5194/os-7-27-2011 |
| [28] |
LUO Y, SHI J, GUO X, et al. Yearly variations in nutrient supply in the East China Sea Due to the Zhejiang Coastal Upwelling and Kuroshio Intrusion[J]. Journal of Geophysical Research: Oceans, 2023, 128: 2022JC019216. DOI:10.1029/2022JC019216 |
| [29] |
GUO X, HUKUDA H, MIYAZAWA Y, et al. A triply nested ocean model for simulating the Kuroshio-Roles of Horizontal Resolution on JEBAR[J]. Journal of Physical Oceanography, 2003, 33(1): 146-169. DOI:10.1175/1520-0485(2003)033<0146:ATNOMF>2.0.CO;2 |
| [30] |
GUO X, YASUMASAM, TOSHIO Y. The Kuroshio onshore intrusion along the shelf Break of the East China Sea: the origin of the Tsushima Warm Current[J]. Journal of Physical Oceanography, 2006, 36: 2205-2231. DOI:10.1175/JPO2976.1 |
| [31] |
WANG Y, GUO X, ZHAO L, et al. Seasonal variations in nutrients and biogenic particles in the upper and lower layers of East China Sea Shelf and their export to adjacent seas[J]. Progress in Oceanography, 2019, 176: 102138. DOI:10.1016/j.pocean.2019.102138 |
| [32] |
ZHANG J, YU Z G, RAABE T, et al. Dynamics of inorganic nutrient species in the Bohai seawaters[J]. Journal of Marine Systems, 2004, 44(3): 189-212. |
| [33] |
万小芳, 吴增茂, 常志清, 等. 南黄海和东海海域营养盐等物质大气入海通量的再分析[J]. 海洋环境科学, 2002, 21(4): 14-18. WAN Xiaofang, WU Zengmao, CHANG Zhiqing, et al. Reanalysis of atmospheric flux of nutrients to the South Yellow Sea and the East China Sea[J]. Marine Environmental Science, 2002, 21(4): 14-18. |
| [34] |
刘昌岭, 陈洪涛, 任宏波, 等. 黄海及东海海域大气湿沉降(降水)中的营养元素[J]. 海洋环境科学, 2003, 22(3): 26-30. LIU Changling, CHEN Hongtao, REN Hongbo, et al. Nutrient elements in wet deposition (precipitation) from the Yellow Sea and the East China Sea regions[J]. Marine Environmental Science, 2003, 22(3): 26-30. |
| [35] |
ZHANG G, ZHANG J, LIU S. Characterization of nutrients in the atmospheric wet and dry deposition observed at the two monitoring sites over Yellow Sea and East China Sea[J]. Journal of Atmospheric Chemistry, 2007, 57(1): 41-57. DOI:10.1007/s10874-007-9060-3 |
| [36] |
ZHANG J, ZHANG G S, BI Y F, et al. Nitrogen species in rainwater and aerosols of the Yellow and East China seas: Effects of the East Asian monsoon and anthropogenic emissions and relevance for the NW Pacific Ocean[J]. Global Biogeochemical Cycles, 2011, 25: GB3020. |
| [37] |
ZHANG J. Nutrient elements in large Chinese estuaries[J]. Continental Shelf Research, 1996, 16(8): 1023-1045. DOI:10.1016/0278-4343(95)00055-0 |
| [38] |
CHEN C A, WANG S. Carbon, alkalinity and nutrient budgets on the East China Sea continental shelf[J]. Journal of Geophysical Research: Oceans, 1999, 104(C9): 20675-20686. DOI:10.1029/1999JC900055 |
| [39] |
WANG W, JIANG W. Study on the seasonal variation of the suspended sediment distribution and transportation in the East China Seas based on SeaWiFS data[J]. Journal of Ocean University of China, 2008, 7(4): 385-392. DOI:10.1007/s11802-008-0385-6 |
| [40] |
SHIN H, LEE J, KIM C, et al. Long-term variation in volume transport of the Tsushima warm current estimated from ADCP current measurement and sea level differences in the Korea/Tsushima Strait[J]. Journal of Marine Systems, 2022, 232: 103750. DOI:10.1016/j.jmarsys.2022.103750 |
| [41] |
ZHENG J, GUO X, MIYAZAWA Y, et al. Diagnostic analysis of the response of volume transport through the Tsushima Strait to the eddy-induced variations in the Kuroshio region[J]. Journal of Physical Oceanography, 2023, 53(11): 2597-2617. DOI:10.1175/JPO-D-22-0164.1 |
| [42] |
SHIN C, MIN H S, LEE S, et al. Current structure and volume transport in the Jeju Strait observed for a year with multiple ADCP moorings[J]. Ocean Science Journal, 2022, 57(3): 365-380. DOI:10.1007/s12601-022-00079-7 |
| [43] |
LIE H, CHO C. Seasonal circulation patterns of the Yellow and East China Seas derived from satellite-tracked drifter trajectories and hydrographic observations[J]. Progress in Oceanography, 2016, 146: 121-141. DOI:10.1016/j.pocean.2016.06.004 |
| [44] |
罗逸飞. 上升流和黑潮入侵对东海营养盐供给与浮游植物生物量年际变化的影响[D]. 青岛: 中国海洋大学, 2023. LUO Yifei. Yearly variations in nutrient supply and phytoplankton biomass in the East China Sea due to the Zhejiang costal upwelling and Kuroshio intrusion[D]. Qingdao: Ocean University of China, 2023. |
| [45] |
GUO X, ZHU X H, WU Q S, et al. The Kuroshio nutrient stream and its temporal variation in the East China Sea[J]. Journal of Geophysical Research: Oceans, 2012, 117(C1): 2011JC007292. DOI:10.1029/2011JC007292 |