 2026, Vol. 50
文章信息
- 周家乐, 李贤, 宋宗诚, 吴乐乐. 2026.
- Zhou Jiale, Li Xian, Song Zongcheng, Wu Lele. 2026.
- 不同光谱下大菱鲆(Scophthalmus maximus)幼鱼肌肉、肝脏内参基因表达水平及稳定性研究
- Expression levels and stability of reference genes in the muscles and livers of juvenile turbots (Scophthalmus maximus) under different light spectra
- 海洋科学, 50(1): 56-64
- Marine Sciences, 50(1): 56-64.
- http://dx.doi.org/10.11759/hykx20250827003
-
文章历史
- 收稿日期:2025-08-27
- 修回日期:2025-10-29


2. 威海圣航水产科技有限公司, 山东 威海 264200
2. Weihai Shenghang Aquatic Product Science and Technology Co., Ltd., Weihai 264200, China
现代水产养殖已从传统粗放模式逐步转向以环境调控为基础的高效、精准养殖模式。养殖环境作为影响鱼类健康与生产效益的核心要素, 其水质、营养、空间结构及光照等关键因子的综合管理, 直接关系到鱼类的生理稳态、行为表达和整体福利水平[1-2]。提升鱼类福利不仅是动物伦理的体现, 更是保障养殖系统可持续运行、增强鱼类抗逆能力、提高产品质量与经济效益的重要途径。在众多环境因子中, 光环境作为一种可精准调控的环境参数, 对鱼类的生长发育、免疫调节、应激响应等生理过程具有显著影响[3-5], 因此成为优化养殖环境、提升鱼类福利的重要研究方向。
在分子层面解析环境调控对鱼类福利的影响机制, 常需借助实时荧光定量技术(quantitative real time fluorescence polymerase chain reaction, qRT- PCR)。该技术以其高灵敏度、强特异性和良好的重复性, 成为基因表达研究中不可或缺的工具[6-7]。定量分析可分为绝对定量和相对定量。相对定量分析在mRNA表达差异分析中应用更加广泛, 需采用内参基因(internal control gene)对目的基因进行校正[8-9], 以消除误差影响。理想的内参基因应是在所有组织中稳定表达, 不受环境因素、发育阶段和组织类型的影响, 研究显示, 在鱼类中, 内参基因表达稳定性受发育阶段、组织类型、环境因子影响, 并非恒定[10-11]。若在光谱环境研究中直接使用未经验证的内参基因, 可能导致数据偏倚, 进而影响对鱼类生理状态与福利水平的准确评估[12-14]。
大菱鲆(Scophthalmus maximus)作为我国北方重要的海水经济鱼类, 自1992年引进以来, 养殖规模持续扩大, 截至2019年底, 辽宁、天津、河北、山东、江苏体系示范区的大菱鲆产量总计62 952.56 t, 产业地位日益凸显[15]。为保障在光谱环境调控研究中基因表达数据的可靠性, 本研究以大菱鲆幼鱼为研究对象, 通过qRT-PCR技术结合GeNorm、NormFinder和BestKeeper算法, 系统评估不同光谱条件下其肝脏和肌肉组织中7个候选内参基因的表达稳定性。研究结果旨在为大菱鲆福利导向型光谱环境优化研究提供可靠的内参基因选择依据, 同时也为其他养殖鱼类在环境-基因互作研究中的实验标准化提供参考。
1 材料与方法 1.1 实验材料本研究于山东威海圣航水产科技有限公司进行, 实验用鱼为人工繁育的健康大菱鲆幼鱼, 由威海圣航水产科技有限公司提供。实验开始前, 3 500尾健康大菱鲆幼鱼(6月龄)在养殖池中(4 m × 4 m × 1 m, 长×宽×高)暂养30 d。暂养结束后, 挑选2 250尾健康、规格相似的大菱鲆幼鱼(7月龄)进行实验, 其平均初始体重为13.06±0.20 g。养殖期间采用工厂化流水养殖模式, 养殖水温为15±4 ℃, 与自然海域水温一致。养殖期间, 采用配合颗粒饲料(青岛龙兴饲料有限公司, 山东青岛)投喂, 每天投喂2次, 投喂量为每缸幼鱼总体重的1.5%。
1.2 实验设计实验共进行75 d。实验开始时, 2 250尾实验用鱼随机分布至15个养殖缸中(养殖缸直径1.5 m, 深1 m)每个养殖缸生物量为1.109 kg/m3。实验期间, 水深约为0.36 m, 水体交换量约为400 L/h。实验用light emitting diode灯具由深圳超频三科技股份有限公司提供。采用5种LED光谱: 红(波峰629 nm)、橙(波峰595 nm)、绿(波峰533 nm)、蓝(波峰450 nm)、全光谱, 每种光谱3个重复。LED灯悬挂于养殖缸中心管正上方, 水面光强为7.04±0.01 μmol·m–2·s–1。采用植物光谱分析仪(PLA-20, 杭州远方光电信息股份有限公司)检测光谱成分和光强。光强每2 d进行1次调整。
1.3 样品采集实验结束后, 每个养殖缸中随机取3尾幼鱼, 立刻使用75 mg/L的三卡因甲基磺酸盐(Tricaine methanesulfonate, MS-222)麻醉, 随后立即解剖取出肝脏和肌肉, 并置于液氮中保存。
1.4 RNA提取和cDNA合成将液氮中保存的肝脏、肌肉样品取出, 用液氮研磨成粉状, 取10 mg左右样品, RNA提取采用总RNA抽提试剂盒(Fastagen, 上海飞捷), 随后通过1%琼脂糖凝胶电泳检测RNA完整性, 并用GeneQuant 1300超微量分光光度计检测RNA浓度。随后使用反转录试剂盒(PrimeScriptTM RT reagent Kit with gDNA Eraser, TaKaRa)合成cDNA, 并置于–20 ℃备用。
1.5 实时荧光定量PCR(qRT-PCR)实验共分析7种内参基因18S ribosomal RNA (18S); b-actin (actb); ribosomal protein L17 (rpl17); atubulin (tuba); elongation factor-1-a (ef1a); b-2- microglobulin (b2m); RNA polymerase Ⅱ subunit d (rpsd)表达的稳定性。
内参基因引物信息如表 1所示。18S基因引物参考Fu等[16], actb, rpl17, tuba, b2m和rpsd基因参照Dang等[17], ef1a基因引物使用Primer Premier 5软件设计。采用荧光定量PCR试剂盒(TB Green Premix Ex Taq, TaKaRa)进行qRT-PCR反应, 首先将模版cDNA进行5倍梯度稀释, 通过1%琼脂糖凝胶电泳和标准曲线法检测引物特异性和引发效率, 随后进行待检测样品的qRT-PCR反应, 获得各内参基因的Ct值。
| 内参基因 | 序列(5′ → 3′) | 引发效率 | 产物大小/bp | NCBI GenBank | |
| 18S | F | ATGGCCGTTCTTAGTTGGTG | 94.70% | 147 | EF126038.1 |
| R | CTCAATCTCGTGTGGCTGAA | ||||
| ef1a | F | CTGGGTGCTGGACAAACTG | 97.30% | 220 | KU057926.1 |
| R | GTTCTTGGAAATACCTGCCTC | ||||
| actb | F | GTAGGTGATGAAGCCCAGAGCA | 98.40% | 204 | EU686692.1 |
| R | CTGGGTCATCTTCTCCCTGT | ||||
| tuba | F | CCCTCGTATCCAITTCCCTC | 99.60% | 287 | DQ848853.1 |
| R | GGTAGTTGATGCCCAICTTGA | ||||
| rpl17 | F | AICAGTGCGTCCCCTTCA | 95.30% | 214 | DQ848879.1 |
| R | CTCATCTTCGGAGCCTTGTTC | ||||
| b2m | F | CTCTGGCTGTTTTCGTCTGCT | 98.70% | 86 | DQ848854.1 |
| R | TCCTTTCCGTTCTCTCCCG | ||||
| rpsd | F | CGGAGGAIGAGCAGGAAI | 95.30% | 102 | DQ848899.1 |
| R | TGCGGAIGGCAGTGATG |
使用geNorm、NormFinder和Bestkeeper分别对肝脏和肌肉中7个内参基因的表达稳定性进行分析, 其中, geNorm和NormFinder分析时, 参照吴建阳等[18]对内参基因Ct值进行2–ΔCt归一化处理。
2 结果与分析 2.1 候选内参基因表达水平分析 2.1.1 肝脏内参基因表达水平如表 1所示, 候选内参基因扩增效率介于90%~ 100%。不同光谱下, 肝脏和肌肉中7种候选内参基因表达水平具有很大差异。肝脏中, 18S基因具有最高的表达水平, 其Ct值最低, 范围为7.49~7.91; tuba基因表达水平最低, 其Ct值最高, 范围为19.48~33.33。不同光谱下, 除18S、ef1a基因表达Ct值不存在显著差异之外, 其他5种候选基因Ct值存在显著差异。全光谱下actb、tuba、b2m、rpsd基因Ct值最低, 蓝光、全光谱下rpl17基因Ct值显著低于其他光谱(表 2)。
| 基因 | 光谱 | ||||
| 红光 | 橙光 | 绿光 | 蓝光 | 全光谱 | |
| 18S | 7.49±0.31 | 7.91±0.64 | 7.82±0.19 | 7.67±0.27 | 7.83±0.018 |
| ef1a | 18.94±0.54 | 19.04±0.72 | 18.97±1.25 | 18.07±0.21 | 17.66±0.57 |
| actb | 20.55±0.84ab | 21.28±1.43b | 20.92±0.65ab | 20.21±0.26ab | 19.65±0.27a |
| tuba | 32.71±0.86c | 33.33±1.29c | 22.58±3.08b | 20.45±0.44ab | 19.48±0.39a |
| rpl17 | 24.29±0.83b | 25.33±2.01b | 23.00±2.71b | 18.48±0.24a | 18.53±0.48a |
| b2m | 21.73±0.55ab | 22.14±0.90b | 21.87±0.32ab | 21.19±0.44ab | 20.87±0.27a |
| rpsd | 24.72±0.45b | 25.22±0.77b | 24.84±0.41b | 24.62±0.54b | 23.43±0.37a |
| 注: 同行数据上标不同字母(a, b, c)表示组间存在显著差异。 | |||||
肌肉中, 18S基因表达水平最高, 其Ct值范围为7.68~8.31; rpsd基因表达水平最低, 其Ct值范围为25.29~25.78。不同光谱下, 18S、ef1a、rpl17、rpsd基因表达Ct值不存在显著差异, actb、tuba和b2m基因在绿光下Ct值最低, 表达水平最高(表 3)。
| 基因 | 光谱 | ||||
| 红光 | 橙光 | 绿光 | 蓝光 | 全光谱 | |
| 18S | 8.07±0.20 | 8.31±0.64 | 7.71±0.35 | 7.68±0.78 | 8.14±0.26 |
| ef1a | 20.39±0.21 | 20.25±0.18 | 19.93±0.49 | 19.89±0.13 | 20.06±0.25 |
| actb | 21.68±0.40b | 21.91±0.56b | 20.28±0.96a | 21.00±0.81ab | 21.74±0.25b |
| tuba | 22.55±0.25ab | 22.89±0.50b | 22.00±0.12a | 22.58±0.24ab | 22.73±0.54b |
| rpl17 | 19.95±0.54 | 20.07±0.61 | 19.94±0.49 | 20.09±0.27 | 20.21±0.28 |
| b2m | 22.45±0.10ab | 22.88±0.50b | 22.14±0.34a | 22.86±0.13b | 22.74±0.15b |
| rpsd | 25.34±0.45 | 25.49±0.38 | 25.29±0.44 | 25.78±0.10 | 25.58±0.31 |
| 注: 同行数据上标不同字母(a, b)表示组间存在显著差异。 | |||||
在geNorm软件分析过程中, 首先将qRT-PCR获得的Ct值经过2–ΔCt归一化处理, 获得相对表达量Q值, 进而通过软件, 计算出内参基因表达稳定值M, M值越小, 内参基因稳定性越高[19]。
如图 1所示, 肝脏中7个候选基因表达稳定性由大到小依次为actb=b2m > rpsd > 18S > ef1a > rpl17 > tuba。利用geNorm可分析内参基因配对变异值, 该算法设定配对变异值阈值为0.15。若Vn/n+1 < 0.15, 则最合适内参基因的数量是n个; 反之, 则为n+1个。由图 2可知, V2/3 < 0.15, 说明两个内参基因即可满足数据分析。两个最佳的内参基因为actb和b2m。
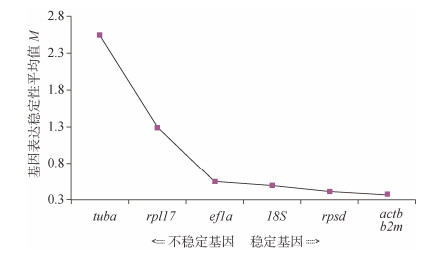 |
| 图 1 不同光谱下大菱鲆幼鱼肝脏内参基因表达稳定性M值(geNorm) Fig. 1 Stability in the expression levels of candidate genes as an internal reference in the livers of juvenile turbot exposed to different light spectra, determined by geNorm |
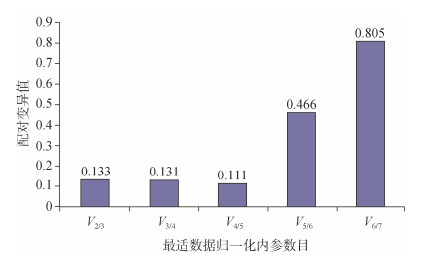 |
| 图 2 geNorm确定不同光谱下大菱鲆幼鱼肝脏基因表达校正所需内参基因数 Fig. 2 Number of internal control genes required for the normalization of expression levels in the livers of juvenile turbots exposed to different light spectra, determined by geNorm |
在Normfinder软件分析过程中, 与geNorm分析类似, 首先需要对基因表达Ct值进行2–ΔCt归一化处理。随后, 通过对候选内参基因表达稳定性S值的计算, 获得最佳内参基因, S值越小, 内参基因稳定性越高[20]。如表 4所示, 本研究中, 肝脏ef1a基因S值最低, 为0.870, 为最优内参基因。
| 基因名 | 表达稳定性S值 |
| 18S | 1.206 |
| ef1a | 0.870 |
| actb | 0.937 |
| b2m | 0.878 |
| rpl17 | 1.379 |
| rpsd | 0.916 |
| tuba | 3.344 |
与geNorm和Normfinder不同, Bestkeeper处理数据时, 不需要对基因表达Ct值进行2–ΔCt归一化处理, 可直接对Ct值进行分析。Bestkeeper判断原则为: 基因表达Ct值标准偏差SD应小于1, 反之, 则不稳定; 相关系数R越大、标准偏差SD和变异系数CV越小, 内参基因稳定性越好[18]。本研究中, 肝脏18S相关性不显著, rpl17和tuba两个基因标准偏差大于1, 因此这3个基因均不适合做为内参基因。综合考虑变异系数、相关系数及相关显著性, b2m基因为肝脏最优内参基因(表 5)。
| 18S | ef1a | actb | b2m | rpl17 | rpsd | tuba | |
| 标准偏差SD | 0.24 | 0.62 | 0.69 | 0.53 | 2.97 | 0.58 | 5.90 |
| 变异系数CV | 3.10 | 3.36 | 3.34 | 2.45 | 13.56 | 2.38 | 22.97 |
| 相关系数R | 0.47 | 0.85 | 0.77 | 0.88 | 0.96 | 0.79 | 0.92 |
| 相关显著性P | 0.078 | 0.001 | 0.001 | 0.001 | 0.001 | 0.001 | 0.001 |
大菱鲆幼鱼肌肉肌肉候选内参基因表达稳定性M值如图 3所示, 7个候选内参基因稳定性由大到小依次是rpl17=rpsd > b2m > tuba > ef1a > 18S > actb。配对变异值分析结果显示, V2/3 < 0.15, 表明两个内参基因即可满足后续qRT-PCR数据分析处理需求(图 4)。两个最佳内参基因为rpl17和rpsd。
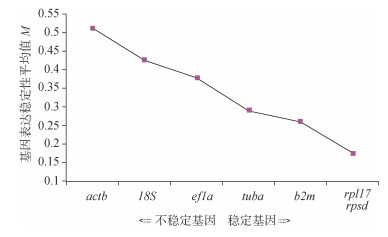 |
| 图 3 大菱鲆幼鱼肌肉内参基因表达稳定性M值(geNorm) Fig. 3 Expression stability of the candidate genes as internal references in the muscle of juvenile turbots exposed to different light spectra, determined by geNorm |
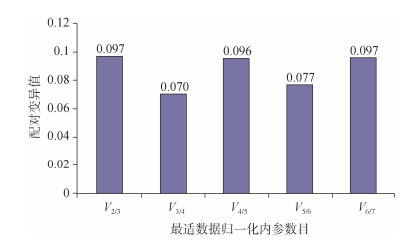 |
| 图 4 geNorm确定不同光谱下大菱鲆幼鱼肌肉基因表达校正所需内参基因数 Fig. 4 Number of internal control genes required for normalization of expression levels in the livers of juvenile turbots exposed to different light spectra, determined by geNorm |
利用Normfinder对大菱鲆幼鱼肌肉候选内参基因表达稳定性进行分析, 结果如表 6所示, 本研究中的tuba内参基因在大菱鲆幼鱼肌肉中的表达稳定性S值最低, 为最佳内参基因。
| 基因名 | 表达稳定性S值 |
| 18S | 0.192 |
| ef1a | 0.210 |
| actb | 0.298 |
| b2m | 0.158 |
| rpl17 | 0.177 |
| rpsd | 0.193 |
| tuba | 0.124 |
如表 7所示, 本研究中, 肌肉rpl17和rpsd基因表达相关性不显著, 18S和actb两个基因变异系数较大, 均不适合做内参基因。ef1a、b2m、tuba三个内参基因中, tuba相关性最强, 为最佳内参基因。
| 18S | ef1a | actb | b2m | rpl17 | rpsd | tuba | |
| 标准偏差SD | 0.30 | 0.23 | 0.63 | 0.26 | 0.34 | 0.31 | 0.34 |
| 变异系数CV | 3.79 | 1.13 | 2.98 | 1.15 | 1.69 | 1.23 | 1.53 |
| 相关系数R | 0.85 | 0.53 | 0.88 | 0.62 | 0.51 | 0.43 | 0.82 |
| 相关显著性P | 0.001 | 0.043 | 0.001 | 0.014 | 0.053 | 0.115 | 0.001 |
工厂化养殖模式是现代水产养殖的重要组成, 福利化养殖的推进高度依赖于对多重环境因子的精准调控。除基础水质参数, 包括溶解氧、温度、pH等和营养盐管理的优化外, 光环境调控日益成为高度依赖人工光源的工厂化养殖系统优化过程的研究热点[21-22]。光谱作为光环境的重要特征, 对养殖鱼类生长发育、摄食、行为、生理状态具有重要影响[5, 23-24]。近年来, 经济鱼类养殖光谱环境调控的报道逐年增加。优化光谱环境, 是提高养殖系统鱼类福利的重要环节[14, 23, 25]。
基因表达检测是评估鱼类应激、代谢及免疫状态的关键技术, 也是分析鱼类对环境因子适应能力、偏好特征和耐受水平的重要手段。内参基因在基于qRT-PCR等技术的基因表达分析中发挥着不可或缺的标准化作用。其核心功能在于校正样本间由RNA起始量、提取效率及反转录效率等技术性变异所引入的系统误差, 确保目标基因相对定量结果的准确性与可比性。然而, 当前研究实践中的一个普遍且严峻的方法学缺陷在于, 诸多研究者惯性依赖于领域内“常用”的内参基因(如β-actin、18S rRNA等), 而忽视了在其特定实验体系(包括但不限于特定细胞、组织类型、发育阶段或环境因子等条件)下对这些内参基因表达稳定性进行严格的实证验证。大量证据表明, 这些基因的表达丰度并非绝对恒定, 极易受到生理、病理或实验性干预的调控[17, 26-27]。直接使用未经验证的不稳定内参基因会引入显著的标准化偏差, 导致对目标基因表达水平的错误估算, 进而可能产生虚假的统计学差异(假阳性)或掩盖真实的表达变化(假阴性), 最终影响研究结论的严谨性与结果的可重复性。然而, 经济鱼类种类繁多, 基于包括光环境在内的多种养殖环境调控的鱼类内参稳定性评估鲜有报道。因此, 遵循规范化流程, 对候选内参基因的稳定性进行系统评估与筛选, 是保证基因表达定量研究可靠性的必要前提。
肝脏和肌肉是鱼类重要的代谢与运动器官, 在能量稳态、解毒机制和免疫调节等生理过程中发挥核心作用。肝脏作为物质代谢和异生物质转化的主要场所, 其基因表达模式易受外界环境调控; 而肌肉组织不仅承担运动功能, 还广泛参与蛋白质合成与能量代谢过程, 是反映鱼类整体生理状态的重要指标。本研究以大菱鲆幼鱼为研究对象, 分析了肝脏、肌肉2个组织的内参基因的表达水平和稳定性, 以期为相关领域研究提供有益借鉴。结果显示, 光谱环境对肝脏和肌肉的内参基因表达水平具有显著影响。在7个候选基因中, geNorm分析出肝脏中最稳定的双内参基因为actb和b2m, 肌肉中最稳定的双内参基因为rpl17和rpsd; Normfinder分析出肝脏中最稳定的单内参基因为ef1a, 而肌肉中最稳定的单内参基因为tuba; Bestkeeper分析出肝脏中最稳定的单内参基因为b2m, 肌肉中最稳定的单内参基因为tuba。表明光谱环境对大菱鲆内参稳定性的影响具有显著的组织特异性, 类似报道同样出现在Guo等[28]和Yang等[29], 因此在选择内参时, 应当遵循规范化的评估流程, 而非笼统地选择常用的内参基因。
本研究中不同分析软件得出的结果差异较大, 主要是由各个软件的算法差异造成的, 在其他研究中也有类似结果[19]。但Normfinder和Bestkeeper分析结果均表明18S、rpl17和tuba不是肝脏中最稳定的内参基因, 肌肉中的最优单内参基因为tuba。3个分析软件各具优点[18], 具体选择可根据后续qRT-PCR数据分析需要确定。在qRT-PCR数据分析中, 目前最常用的方法为2‒ΔΔCt法和Pfaffl法[6, 30-31]。其中, 2‒ΔΔCt法操作简便、应用广泛, 适用于大多数实验场景。为提高结果的可靠性, 通常建议采用双内参基因进行分析, 此时可借助geNorm软件筛选表达最稳定的内参基因组合, 在进行肝脏、肌肉分析时分别选择actb和b2m、rpl17和rpsd作为2个组织的双内参基因。而Pfaffl法尽管在操作上较为复杂, 但其优势在于能够引入引物的扩增效率参数, 从而获得更为准确的分析结果[31]。该方法在单内参基因条件下即可有效运行, 因此推荐使用Normfinder或Bestkeeper来评估并选择稳定性最佳的内参基因, 在肝脏分析时选择ef1a或b2m作为内参基因, 在肌肉分析时选择tuba作为内参基因。
实际上, 经济鱼类物种多样, 且其基因表达易受各类环境因子的影响。这决定了内参基因的稳定性评估必须遵循“具体物种-具体条件-具体组织”的原则。传统上被视为稳定的“管家基因”, 实际上其转录水平常随性别、发育阶段或环境刺激而发生改变, 因而难以在所有条件下均一表达[17]。正因物种与影响因素的多样性交织, 针对特定实验体系进行严谨的内参验证, 是确保基因表达数据准确性的不可或缺的一环。
4 结论不同光谱对大菱鲆幼鱼肝脏和肌肉中内参基因的表达水平具有显著影响。肝脏中。actb、tuba、b2m、rpsd基因在全光谱下表达水平最高, 蓝光和全光谱下rpl17基因表达水平显著高于其他光谱。肌肉中, actb、tuba和b2m基因在绿光下表达水平最高。内参基因表达稳定性在肝脏和肌肉中具有组织特异性。在肝脏中, 最佳的双内参基因组合为actb和b2m, 最佳的单内参基因为ef1a或b2m。在肌肉中, 最佳的双内参基因组合为rpl17和rpsd, 最佳的单内参基因为tuba。综上所述, 本研究通过多种算法系统评估了不同光谱下大菱鲆幼鱼的内参基因稳定性, 并据此提出具体选择建议: 进行双内参基因校正时, geNorm推荐的组合(肝脏: actb与b2m; 肌肉: rpl17与rpsd)最为可靠; 在进行单内参分析时, 肝脏组织可选择Normfinder确定的ef1a或Bestkeeper确定的b2m, 而肌肉组织则可采用2种算法确定的tuba。
| [1] |
Ashiley P J. Fish welfare: Current issues in aquaculture[J]. Applied Animal Behaviour Science, 2007, 104(3/4): 199-235. |
| [2] |
李贤, 刘鹰. 水产养殖中鱼类福利学研究进展[J]. 渔业现代化, 2014, 41(1): 40-45. Li Xian, Liu Ying. Current research advances on fish welfare in aquaculture[J]. Fishery Modernization, 2014, 41(1): 40-45. |
| [3] |
Choi J Y, Kim T H, Choi Y J, et al. Effects of various LED light spectra on antioxidant and immune response in juvenile rock bream, Oplegnathus fasciatus exposed to bisphenol A[J]. Environmental Toxicology and Pharmacology, 2016, 45: 140-149. DOI:10.1016/j.etap.2016.05.026 |
| [4] |
Hou Z S, Wen H S, Li J F, et al. Effects of photoperiod and light spectrum on growth performance, digestive enzymes, hepatic biochemistry and peripheral hormones in spotted sea bass (Lateolabrax maculatus)[J]. Aquaculture, 2019, 507: 419-427. DOI:10.1016/j.aquaculture.2019.04.029 |
| [5] |
Villamizar N, Blanco-Vives, Migaud H, et al. Effects of light during early larval development of some aquacultured teleosts: A review[J]. Aquaculture, 2011, 315(1/2): 86-94. |
| [6] |
Livak K J, Schmittgen T D. Analysis of relative gene expression data using real-time quantitative PCR and the 2‒ΔΔCt method[J]. Methods, 2001, 25(4): 402-408. DOI:10.1006/meth.2001.1262 |
| [7] |
丁博群, 刘珊娜. 荧光定量PCR技术在食品快速检测中的应用[J]. 食品工业科技, 2021, 42(7): 366-373. Ding Boqun, Liu Shanna. Application of real-time quantitative PCR technology in food rapid detection[J]. Science and Technology of Food Industry, 2021, 42(7): 366-373. |
| [8] |
Allen D, Winters E, Kenna P F, et al. Reference gene selection for real-time rtPCR in human epidermal keratinocytes[J]. Journal of Dermatological Science, 2008, 49(3): 217-225. DOI:10.1016/j.jdermsci.2007.10.001 |
| [9] |
Tine M, De Lorgeril J, Panfili J, et al. Growth hormone arid Prolactin-1 gene transcription in natural populations of the black-chinned tilapia Sarotherodon melanotheron acclimatised to different salinities[J]. Comparative Biochemistry and Physiology B-Biochemistry & Molecular Biology, 2007, 147(3): 541-549. |
| [10] |
Faheem M, Jahan N, Khaliq S, et al. Validation of reference genes for expression analysis in a teleost fish (Catla catla Hamilton) exposed to an endocrine-disrupting chemical, bisphenol-A[J]. Rendiconti Lincei- Scienze Fisiche E Naturali, 2018, 29(1): 13-22. DOI:10.1007/s12210-017-0653-8 |
| [11] |
Mahanty A, Purohit G K, Mohanty S, et al. Suitable reference gene for quantitative real-time PCR analysis of gene expression in gonadal tissues of minnow Puntius sophore under high-temperature stress[J]. BMC Genomics, 2017, 18: 617. DOI:10.1186/s12864-017-3974-1 |
| [12] |
Brüning A, Hölker F, Franke S, et al. Impact of different colours of artificial light at night on melatonin rhythm and gene expression of gonadotropins in European perch[J]. Science of the Total Environment, 2016, 543: 214-222. DOI:10.1016/j.scitotenv.2015.11.023 |
| [13] |
Wu L L, Han M M, Song Z C, et al. Effects of different light spectra on embryo development and the performance of newly hatched turbot (Scophthalmus maximus) larvae[J]. Fish & Shellfish Immunology, 2019, 90: 328-337. |
| [14] |
魏平平, 李鑫, 费凡, 等. 光谱对红鳍东方鲀仔稚鱼生长及相关基因表达量的影响[J]. 大连海洋大学学报, 2019, 34(5): 668-673. Wei Pingping, Li Xin, Fei Fan, et al. Effects of light spectrum on growth and related gene expression of larval and juvenile tiger puffer Takifugu rubripes[J]. Journal of Dalian Ocean University, 2019, 34(5): 668-673. |
| [15] |
关长涛, 杨正勇, 王启要, 等. 大菱鲆产业发展报告[J]. 中国水产, 2021(1): 22-35. |
| [16] |
Fu Q, Yang N, Gao C B, et al. Characterization, expression signatures and microbial binding analysis of cathepsin A in turbot, Scophthalmus maximus L. (SmCTSA)[J]. Fish & Shellfish Immunology, 2018, 81: 21-28. |
| [17] |
Dang W, Sun L. Determination of internal controls for quantitative real time RT-PCR analysis of the effect of Edwardsiella tarda infection on gene expression in turbot (Scophthalmus maximus)[J]. Fish & Shellfish Immunology, 2011, 30(2): 720-728. |
| [18] |
吴建阳, 何冰, 杜玉洁, 等. 利用geNorm、NormFinder和BestKeeper软件进行内参基因稳定性分析的方法[J]. 现代农业科技, 2017(5): 278-281. Wu Jianyang, He Bing, Du Yujie, et al. Analysis method of systematically evaluating stability of reference genes using geNorm, NormFinder and BestKeeper[J]. Modern Agricultural Science and Technology, 2017(5): 278-281. |
| [19] |
张羽佳, 舒读, 董雪, 等. 大别山黄杜鹃根茎叶花内参基因的表达稳定性评价[J]. 分子植物育种, 2020, 18(21): 6963-6968. Zhang Yujia, Shu Du, Dong Xue, et al. Evaluation of suitable reference genes for qRT-PCR normalizaiton in Rhododendron molle G. Don (Dabie Mountains)[J]. Molecular Plant Breeding, 2020, 18(21): 6963-6968. |
| [20] |
Lindbjerg A C, Ledet J J, Falck Ø T. Normalization of real-time quantitative reverse transcription-PCR data: a model-based variance estimation approach to identify genes suited for normalization, applied to bladder and colon cancer data sets[J]. Cancer Research, 2004, 64(15): 5245-5250. DOI:10.1158/0008-5472.CAN-04-0496 |
| [21] |
李鑫星, 朱晨光, 周婧, 等. 光谱技术在水产养殖水质监测中的应用进展及趋势[J]. 农业工程学报, 2018, 34(19): 184-194. Li Xinxing, Zhu Chenguang, Zhou Jing, et al. Review and trend of water quality detection in aquaculture by spectroscopy technique[J]. Transactions of the Chinese Society of Agricultural Engineering, 2018, 34(19): 184-194. |
| [22] |
林建斌. 水产养殖与水产动物福利浅析[J]. 中国水产, 2012(9): 31-33. Lin Jianbin. Abrief analysis of aquaculture and aquatic animal welfare[J]. China Fisheries, 2012(9): 31-33. |
| [23] |
Karakatsouli N, Papoutsoglou S E, Pizzonia G, et al. Effects of light spectrum on growth and physiological status of gilthead seabream Sparus aurata and rainbow trout Oncorhynchus mykiss reared under recirculating system conditions[J]. Aquacultural Engineering, 2007, 36(3): 302-309. DOI:10.1016/j.aquaeng.2007.01.005 |
| [24] |
Wang H, Shi W J, Wang L, et al. Light conditions for commercial hatching success in Nile tilapia (Oreochromis niloticus)[J]. Aquaculture, 2019, 509: 112-119. DOI:10.1016/j.aquaculture.2019.05.027 |
| [25] |
崔鑫. 光谱和光强对欧洲舌齿鲈(Dicentrarchus labrax)幼鱼生长、存活和发育的影响[D]. 大连: 大连海洋大学, 2019. Cui Xin. Growth, development, and survival of European sea bass (Dicentrarchus labrax) larvae cultured under different lightspectra and intensities[D]. Dalian: Dalian Ocean University, 2019. |
| [26] |
龙治海, 陈虎, 汪斌, 等. 达氏鲟内参基因β-actin、GAPDH和EF1-α的克隆及表达稳定性[J]. 农业生物技术学报, 2018, 26(11): 1846-1855. Long Zhihai, Chen Hu, Wang Bin, et al. Cloning and expression stability of reference genes β-actin, GAPDH and EF1-α in Acipenser dabryanus[J]. Journal of Agricultural Biotechnology, 2018, 26(11): 1846-1855. |
| [27] |
吴勇亮, 杨颖康, 谭淑雯, 等. 急性镉胁迫下草鱼肝胰脏中几个内参基因表达稳定性的比较研究[J]. 家畜生态学报, 2018, 39(7): 16-9, 41. Wu Yongliang, Yang Yingkang, Tan Shuwen, et al. Stability evaluation of reference genes in grass carp (Ctenopharyngodon idellus) liver under acute cadmium exposure[J]. Acta Ecologiae Animalis Domastici, 2018, 39(7): 16-9, 41. |
| [28] |
Guo C H, Zhang Z H, Zhang M N, et al. Screening and stability analysis of reference genes for gene expression normalization in hybrid yellow catfish (Pelteobagrus fulvidraco ♀ x Pelteobagrus vachelli ♂) fed diets containing different soybean meal levels[J]. Aquaculture Nutrition, 2023, 2023: 232518. |
| [29] |
Yang C G, Wang X L, Tian J, et al. Evaluation of reference genes for quantitative real-time RT-PCR analysis of gene expression in Nile tilapia (Oreochromis niloticus)[J]. Gene, 2013, 527(1): 183-192. DOI:10.1016/j.gene.2013.06.013 |
| [30] |
Pfaffl M W. A new mathematical model for relative quantification in real-time RT-PCR[J]. Nucleic Acids Research, 2001, 29(9): e45. DOI:10.1093/nar/29.9.e45 |
| [31] |
刘正霞, 徐阳, 徐进梅, 等. 不同引物及数据分析方法对定量PCR结果的影响[J]. 南京医科大学学报(自然科学版), 2009, 29(8): 1112-1117. Liu Zhengxia, Xu Yang, Xu Jingmei, et al. The Effects of different primers and data analysis methods on real-time PCR[J]. Journal of Nanjing Medical University (Natural Sciences), 2009, 29(8): 1112-1117. |