 2017, Vol. 48
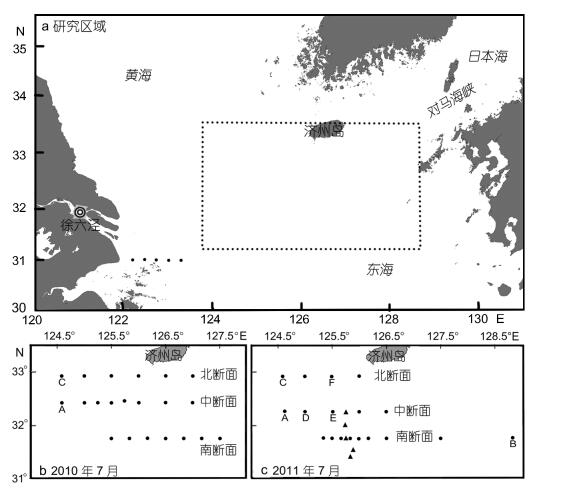


夏季东海东北部营养盐的分布变化特征

http://dx.doi.org/10.11693/hyhz20170100020
中国海洋湖沼学会主办。
中国海洋湖沼学会主办。
文章信息
- 刘雅丽, 高磊, 陈炜清, 王腾, 李道季. 2017.
- LIU Ya-Li, GAO Lei, CHEN Wei-Qing, WANG Teng, LI Dao-Ji. 2017.
- 夏季东海东北部营养盐的分布变化特征
- DYNAMICS OF NUTRIENTS IN THE NORTHEASTERN EAST CHINA SEA IN SUMMER
- 海洋与湖沼, 48(4): 733-744
- Oceanologia et Limnologia Sinica, 48(4): 733-744.
- http://dx.doi.org/10.11693/hyhz20170100020
-
文章历史
- 收稿日期:2017-01-20
- 收修改稿日期:2017-05-22
引用本文
刘雅丽, 高磊, 陈炜清, 王腾, 李道季. 2017. 夏季东海东北部营养盐的分布变化特征[J]. 海洋与湖沼, 48(4): 733-744
LIU Ya-Li, GAO Lei, CHEN Wei-Qing, WANG Teng, LI Dao-Ji. 2017. DYNAMICS OF NUTRIENTS IN THE NORTHEASTERN EAST CHINA SEA IN SUMMER[J]. Oceanologia et Limnologia Sinica, 48(4): 733-744.
夏季东海东北部营养盐的分布变化特征
河口海岸学国家重点实验室 华东师范大学 上海 200062
摘要:分别于2010年7月和2011年7月,在沿长江冲淡水扩散方向的东海东北部海域进行了典型站点CTD参数的测定和营养盐样品的采集,旨在了解长江不同径流量条件下该区域对长江冲淡水的响应过程及其中营养盐的分布变化特点。结果显示:在长江径流量较大的2010年7月,长江冲淡水(盐度 < 31)在研究区域表层自西向东的扩散范围明显大于径流量较小的2011年7月。而含有高浓度NO3-N(如>15μmol/L)海水扩散范围在两个航次的变化却相反。由于海水层化以及表层浮游植物的吸收,各站表层NO3-N、SiO3-Si、PO4-P等浓度一般较低,温盐跃层和次表层叶绿素最大值层以下其浓度升高并逐渐趋于稳定。2010年7月NH4-N在研究区域各站贯穿整个深度的浓度明显大于2011年7月。与长江冲淡水和长江口相比,东海东北部水体表层SiO3-Si/NO3-N和PO4-P/NO3-N等营养盐摩尔比值明显降低。黑潮次表层水和黑潮中层水等水团含有较高的营养盐浓度(NO3-N,SiO3-Si及PO4-P),与长江冲淡水相比,可能构成了东海东北部另一个重要的营养盐来源。
关键词:营养盐 生物地球化学过程 长江冲淡水 黑潮 次表层叶绿素最大值层 东海东北部
DYNAMICS OF NUTRIENTS IN THE NORTHEASTERN EAST CHINA SEA IN SUMMER
State Key Laboratory of Estuarine and Coastal Research, East China Normal University, Shanghai 200062, China
Abstract:
Two cruises in July 2010 and July 2011 were conducted in the northeastern East China Sea (ECS) to elucidate distribution and variation of nutrients in this area, as well as their responses to the varying Changjiang (Yangtze) River freshwater discharge. The eastward expansion range of Changjiang Diluted Water (CDW, in salinity < 31) at surface in July 2010 when monthly water discharge was much greater than normal year, was obviously larger than that in July 2011. However, the expansion range of surface seawater with high NO3-N concentration (e.g., >15μmol/L) was much smaller in July 2010. Concentrations of NO3-N, SiO3-Si, PO4-P at most stations were generally quite low due to surface phytoplankton uptake and water column stratification, and these low values were maintained to the temperature/salinity thermocline and subsurface chlorophyll maximum layer (at depths of 10-40m) where their concentration increased sharply and then showed constant values afterwards. The concentrations of NH4-N at stations in July 2010 were commonly higher than those in July 2011, throughout the water columns and over the whole study area. Molecular ratios of SiO3-Si/NO3-N and PO4-P/NO3-N decreased along the Changjiang River transport pathway northeastwards from the Changjiang River freshwater and estuarine water to the northeastern ECS. The nutrient concentrations of NO3-N, SiO3-Si, and PO4-P in the Kuroshio Subsurface Water and Kuroshio Intermediate Water were quite high, indicating that those water masses, together with CDW, were probably important contributors to the nutrients inventories of the northeastern ECS.
Key words:
nutrients
biogeochemistry
Changjiang River diluted water
Kuroshio
subsurface chlorophyll maximum layer
northeastern East China Sea
东海是西太平洋中半封闭的陆架边缘海, 是世界最大的陆架海之一, 其北部与黄海以长江口-济州岛连线为界, 东北部通过对马海峡与日本海相连, 南部通过台湾海峡与南海相连, 东部和东南部与太平洋以冲绳海槽为界(图 1)。该区域水动力环境复杂, 受到长江冲淡水、东海陆架水、台湾暖流、黑潮表层水(Kuroshio surface water, KSW)、黑潮次表层水(Kuroshio subsurface water, KSSW)、黑潮中层水(Kuroshio intermediate water, KIW)等水团影响, 并具有强烈的季节变化特征(Beardsley et al, 1985; Chen et al, 1994; Zhang et al, 2007; Chang et al, 2014)。各种陆源生源要素被长江径流携带进入到长江口及邻近东海, 并随着长江冲淡水的扩展在东海陆架经历着复杂的生物地球化学过程(Isobe et al, 2008; Sasaki et al, 2008)。受到长江径流等因素的影响, 东海陆架海水中营养盐浓度和生产力水平普遍较高(Hama et al, 1997; Kanda et al, 2003; Wang et al, 2014)。
受到人类活动的加剧和气候变化的影响, 近几十年来长江输出氮、磷营养盐浓度和通量显著升高(Yan et al, 2010; Gao et al, 2012), 与之紧密联系的长江口及其邻近东海海域营养盐等生源要素浓度和结构、初级生产力、生态系统组成也发生着相应的改变(Gong et al, 2006; Jiao et al, 2007; Zhou et al, 2008; Chai et al, 2009)。尤其在最近10—20年, 东海生态环境又发生了进一步的变化, 表现为硅藻和甲藻赤潮、水母暴发事件以及相邻海域(黄海)浒苔暴发事件发生的频率明显增多(Xian et al, 2005; Zhou et al, 2008; Shi et al, 2009; Xu et al, 2013; Wang et al, 2015)。事实上在本研究2011年7月东海东北部的航次中, 在研究区域各站也多次观测到大规模的浒苔漂浮现象。
受潮汐、季风等因素的影响, 在夏季径流量急剧增大的情况下, 长江冲淡水一支向东北方向扩展, 最远可经济州岛附近海域进入对马海峡(Wang, 1988; 赵保仁, 1991; Isobe et al, 2002; Lie et al, 2003)。Chang等(2003)发现, 68%的长江径流可能经过东海东北部进入对马海峡。Senjyu等(2006)发现, 经过东海东北部、对马海峡进入到日本海的低盐海水与长江径流量存在着紧密关系。东海东北部直至对马海峡对于整个中国近海生源要素的收支及随后它们在大洋中的生物地球化学行为具有十分重要的意义(Morimoto et al, 2009)。而我国以往在东海关于营养盐生物地球化学的研究集中于长江口及其邻近海域(Wang, 2006; Zhang et al, 2007; Liu et al, 2016), 对东海东北部的研究相对较少。事实上, 距离长江口较远的东海东北部海洋生态系统在最近几十年来也在经历着复杂而深刻的变化过程:如Siswanto等(2008)的研究表明, 夏季该区域海水表层溶解无机氮浓度在最近几十年来也在显著升高。
基于以上考虑, 依托与日本名古屋大学的合作, 于2010年7月和2011年7月在东海东北部海域进行了两个航次的考察(图 1)。本文尝试为回答下列科学问题提供初步结果: 1.在洪季长江不同径流量条件下, 东海东北部能否直接“捕捉”到长江冲淡水的信号?2.洪季营养盐在该海域有什么基本的分布变化规律?尤其是其中“捕捉”到的长江冲淡水信号中营养盐的分布和变化有何特点?3.该海域营养盐分布变化受哪些主要因素控制?其中长江冲淡水、温度/盐度跃层、黑潮等因素的影响是怎样体现的?4.营养盐摩尔比值(如SiO3-Si/NO3-N、PO4-P/NO3-N、NH4-N/NO3-N)在洪季沿着长江冲淡水东北方向扩展整个路径上(从长江淡水端元、到长江口、再到东海东北部)有怎样的基本变化规律?
1 材料与方法通过参加日本名古屋大学组织的“长崎丸号”搭载航次, 分别于2010年7月和2011年7月在东海东北部(济州岛以南、对马海峡以西)三个断面各站点进行了CTD(温盐深仪)参数的测定和营养盐样品的采集(图 1)。研究区域处在31.42°—32.92°N、124.58°— 128.75°E之间(图 1)。其中北断面位于32.92°N, 中断面位于32.42°N(2010年7月)或32.25°N(2011年7月), 南断面位于31.75°N(图 1b, c)。除了2011年7月的站点B以外(水深790m, 位置见图 1c, 2010年7月航次在该站点没有采集样品), 其余站点水深均小于132m。
在两个航次的每个站点, 使用CTD并在其下降过程中测定海水温度、盐度、荧光强度的垂直剖面(包括确定次表层叶绿素最大值层, subsurface chlorophyll maximum layer, SCM层), 在其返回上升过程中使用围绕CTD的12个采水器对相关层次的海水样品进行采集。固定采样层次为0、10、20、30、40、50、75、100m;此外, 在SCM层和离海底5m两个层次也进行了样品采集。其中2011年7月航次在F站点附近存在夜光藻赤潮现象, 于是在赤潮核心区域也进行了上述方法的海水样品采集。样品采集后立即使用孔径为0.7μm的Whatman GF/F膜过滤(GF/F膜使用海水样品过滤清洗三遍后才接滤液), 滤液随即冷冻保存直至测定。
样品带回实验室后使用SKALAR Sanplus流动注射式营养盐自动分析仪进行测定, 分析方法为传统的分光光度法。在NO3-N测定过程中, 首先使用Cd-Cu柱将NO3-N还原为NO2-N得到NO3-N与NO2-N浓度之和, 再将该值减去NO2-N浓度得到最终NO3-N结果。测定SiO3-Si的样品经过了48h以上的解冻。NO3-N、NH4-N、NO2-N的检出限均为0.14μmol/L, SiO3-Si和PO4-P的检出限分别为0.07和0.06μmol/L。详细的质量控制流程见Gao等(2012)。
2 结果 2.1 表层盐度分布根据水利部《2010年长江泥沙公报》和《2011年长江泥沙公报》(水利部长江水利委员会, 2011, 2012), 长江干流大通站2010年和2011年的年径流量分别为10.22×10¹¹m3/年和6.67×1011m3/年, 前者是后者的约1.5倍。相较于1950—2010年60年来长江的年平均径流量8.96×10¹¹m3/年, 2010年的年径流量明显偏高, 而2011年偏低。2010年和2011年的月径流量最大值均出现在7月, 其中2010年7月的月径流量为1.65×10¹¹m3/月, 2011年7月为0.98×10¹¹m3/月, 前者是后者的约1.7倍。2010年7月和2011年7月长江月径流量的较大变化为研究东海东北部营养盐的分布变化对年际间长江不同径流量的响应提供了难得的时机。
长江冲淡水在冬季受到北风和科氏力等因素的影响, 往往沿着近岸向南流动, 而在夏季往往形成东北和东南方向两个分支(Beardsley et al, 1985; Ichikawa et al, 2002; Lee et al, 2003)。研究区域处在长江冲淡水夏季东北扩散方向的路径上。图 2显示了两个航次表层盐度的分布, 其中以盐度31作为长江冲淡水的边界(毛汉礼等, 1963; Gong et al, 1996; Shan et al, 2009; Chang et al, 2014)。尽管研究区域离长江口直线距离在200km以上, 两个航次仍都成功“捕捉”到了长江冲淡水的信号。两个航次盐度的最低值均出现在站点A的表层, 分别为19.1(2010年7月)和22.3(2011年7月), 说明长江冲淡水及其携带的陆源物质可以直接对研究区域产生影响。在长江径流量较大的2010年7月, 长江冲淡水的扩散范围明显大于径流量较小的2011年7月; 前者盐度31的等值线大部分在126.5°E以东, 而后者该等值线局限在125.5°E附近(图 2)。长江冲淡水是以“斑块化”的形式传递的(Lie et al, 2003; Chen et al, 2008; Moon et al, 2010), 意味着沿着长江冲淡水的传递方向, 盐度大于31的海水在比研究区域(东海东北部)距离口门更近的海域(如长江口)就已经出现(Gao et al, 2015)。在2011年7月, 中断面最东端站点的表层盐度(30.3) 也低于与之相邻、但距离口门更近的西端站点(表层盐度32.5) 和南端站点(表层盐度31.7), 因此在图 2b中也形成了一个小尺度“低盐度斑块”。
 |
| 图 2 两个航次表层盐度分布 Fig. 2 Distributions of salinity at surface during the two cruises 注: b小图不包括南断面最东端站点B, 盐度31的等值线用红线显示 |
无论是2010年7月还是2011年7月, 三个断面盐度分布均显示出了明显的层化特征(图 3)。在径流量较大的2010年7月, 三个断面表层均有较大范围的长江冲淡水分布, 其向下可以延伸到水深约20m处(图 3a, b, c)。而在2011年7月, 只在中断面表层至水深20—30m处发现了明显的长江冲淡水信号; 在其余两个断面, 盐度小于31的海水只出现在最西边的站点表层(图 3d, e, f)。两个航次三个断面SCM层往往出现在水深10—40m处, 并且两个航次均发现了盐度大于34的水团从东部底层锲入(图 3)。
 |
| 图 3 两个航次三个断面盐度的垂直剖面 Fig. 3 Vertical profiles of salinity along the three transects during the two cruises 注:在各图中, 次表层叶绿素最大值层以绿色虚线标注, 盐度=31和34的等值线分别以红线和蓝线标注 |
两个航次NO3-N在研究区域的表层均呈现出西边浓度高、东边浓度低的基本分布特征, 并且在各航次盐度最低的站点A表层其浓度在所有样品中达到最高值(图 4), 以上说明长江冲淡水仍然是东海东北部表层营养盐的最主要提供者。较大的长江径流量使得2010年7月研究区域表层相较于2011年7月更多地受到长江冲淡水的影响(图 2)。由于长江冲淡水往往携带着较高浓度的NO3-N(Gao et al, 2015), 按照一般的理解, 2010年7月研究区域表层NO3-N浓度也应高于2011年7月同一站点的结果, 可是图 4得到的结果却正好相反:含高NO3-N浓度(如 > 15μmol/L)的长江冲淡水显然在2011年7月扩散得更远。仍以站点A为例, 尽管该处2010年7月的表层盐度(19.1) 低于2011年7月(22.3), 但前者NO3-N浓度(17.5μmol/L)反而明显低于后者(27.8μmol/L)。两个航次间表层不同的NO3-N浓度分布可能也与2010年7月和2011年7月长江淡水端元NO3-N的不同浓度有关。
 |
| 图 4 两个航次表层NO3-N浓度分布 Fig. 4 Distributions of NO3-N concentration at surface during the two cruises 注: b小图不包括2011年7月南断面最东端站点B, 盐度31的等值线同时用红线显示, 两张分图营养盐浓度采用同一颜色标尺 |
与NO3-N不同, 研究区域表层SiO3-Si的分布显示出了“西低东高”的特征。对于PO4-P, 研究区域其表层浓度普遍接近或低于检出限。对于NO2-N, 2010年7月除了站点A和C(其浓度分别为0.66和0.70μmol/L), 2011年7月除了站点A、C、D、E外(其浓度分别为0.78、0.51、0.81、0.45μmol/L), 其余站点浓度均接近或低于检出限; 整体上NO2-N浓度也呈现出“西高东低”的分布特征。
NH4-N表层浓度在两个航次之间呈现出很不同的分布特征(图 5)。2010年7月研究区域所有采集样品的NH4-N浓度范围为4.5—10.5μmol/L(平均值7.6μmol/L, n=21), 其浓度变化与SiO3-Si类似, 整体呈现出“西低东高”的分布规律。2011年7月研究区域表层NH4-N浓度与2010年7月相比整体偏低, 变化范围为2.9—6.3μmol/L(平均值4.3μmol/L, n=22), 并且没有显示出“西低东高”或“西高东低”的分布特征。站点F在2011年7月的浓度最大值(6.3μmol/L, 见图 5b)应该与当地发生的夜光藻赤潮有关(在该站点附近赤潮核心区域采集到的表层海水测得NH4-N浓度更高达24.0μmol/L, 该数值未显示在图 5b中)。
 |
| 图 5 两个航次表层NH4-N浓度分布 Fig. 5 Distributions of NH4-N concentration at surface during the two cruises 注: b小图不包括南断面最东端站点B, 盐度31的等值线同时用红线显示, 两张分图营养盐浓度采用同一颜色标尺 |
图 6显示的是两个航次各断面NO3-N的垂直分布剖面。大部分站点由上至下NO3-N浓度逐渐升高。SCM层对NO3-N浓度垂直剖面的控制作用明显: SCM层之上NO3-N浓度维持在较低水平, SCM层之下NO3-N浓度随即升高并始终维持在较高水平直至海底。只有在少数站点, 如2011年7月中断面最西端两个站点, 由于表层受到强烈的高NO3-N浓度长江冲淡水控制, 其浓度剖面显示出由上到下逐渐降低的特征(图 6e)。通过两个航次之间的比较, 发现2011年7月底部NO3-N浓度普遍比2010年7月高。另外, 盐度大于34的水团所含NO3-N浓度往往超过10 μmol/L。注意到各断面底部中间站位NO3-N浓度相较于东、西两侧往往偏低(图 6), 说明研究区域底部较高的NO3-N浓度可能有着不同的来源:西侧更多地受到长江冲淡水等陆源水团或近岸水团的影响, 东部则更多地受到外海高盐水团的影响。
 |
| 图 6 两个航次三个断面NO3-N浓度的垂直剖面 Fig. 6 Vertical profiles of NO3-N concentration along the three transects during the two cruises 注:在各图中, 次表层叶绿素最大值层以绿色虚线标注, 盐度=31和34的等值线分别以红线和蓝线标注, 各分图营养盐浓度采用同一颜色标尺 |
两个航次SiO3-Si在三个断面各站点也大多呈现出由上到下逐渐升高的特征, 即使在受到长江冲淡水强烈影响的西部站点, 其表层也没有发现较高的SiO3-Si浓度(分布图未显示)。2010年7月中断面西部站点底层和2011年7月南断面盐度大于34的底层水团均含有明显升高的SiO3-Si浓度( > 15μmol/L)。与SiO3-Si类似, 两个航次各站位PO4-P也基本显示出由上至下逐渐升高的垂直剖面特征(分布图未显示); 两者稍有不同的是, SCM层对PO4-P的浓度控制更加明显, 各站SCM层之上PO4-P浓度一般小于0.5μmol/L, 而SCM层之下PO4-P浓度一般大于0.5μmol/L, 两个航次三个断面各站点SCM层连线与PO4-P的0.5μmol/L浓度等值线高度重合。底层盐度大于34的高盐水团往往含有较高的PO4-P浓度( > 0.8μmol/L)。对于NO2-N, 除了西部长江冲淡水控制的水团NO2-N浓度可以超过0.5μmol/L以外, 其余站点基本上处于低NO2-N浓度的状态, 其浓度接近或低于检出限。
前文已经提及, 图 5显示研究区域表层NH4-N浓度在2011年7月整体低于2010年7月, 而图 7则进一步显示2011年7月较低的NH4-N浓度贯穿于三个断面整个深度。2011年7月三个断面所有样品NH4-N浓度基本小于5μmol/L, 而2010年7月水体中NH4-N浓度基本在5μmol/L以上。NH4-N的结果表明研究区域水体环境在两个航次可能处于不同状态之中。与其他营养盐相比, 同一站点NH4-N浓度的垂直变化最不明显, 较多地呈现出上下均一的垂直剖面特征(图 7)。2010年7月航次研究区域较高浓度NH4-N的来源机制值得进一步研究。
 |
| 图 7 两个航次三个断面NH4-N浓度的垂直剖面 Fig. 7 Vertical profiles of NH4-N concentration along the three transects during the two cruises 注:在各图中, 次表层叶绿素最大值层以绿色虚线标注, 盐度=31和34的等值线分别以红线和蓝线标注, 各分图营养盐浓度采用同一颜色标尺 |
长江携带大量营养盐进入东海, 经远距离传输可以扩散到东海东北部(Moon et al, 2009)。在本研究中发现, 在径流量较小的2011年7月, 长江冲淡水在东海东北部自西向东的扩散范围明显小于2010年7月(图 2, 3)。此外, NO3-N和NH4-N在两个航次间显示出了很不同的浓度和分布变化特征(图 4—7)。
Gao等(2015)通过对比长江冲淡水“斑块化”传递过程中相同盐度、但处在不同斑块中水团的营养盐浓度, 发现NO3-N、SiO3-Si、PO4-P等营养盐在表层长江冲淡水的传输路径中, 尽管存在局部浓度增加的可能性, 但排除稀释过程后这些营养盐“整体”上也是处于不断地被移除的状态。在本研究中, 除了以上两个东海东北部的航次外, 2010年7月和8月在长江淡水端元(徐六泾), 2010年8月和2011年8月在长江口海域还“同时”开展了补充航次(站点见图 1), 测定了长江冲淡水中营养盐浓度沿着传递方向连续的变化。从长江淡水端元(徐六泾)到长江口海域再到东海东北部, NO3-N、SiO3-Si、PO4-P浓度均呈下降趋势, 而NH4-N和NO2-N浓度则在夏季总体升高(Gao et al, 2015)。
此外, 我们进一步比较了三个区域的营养盐结构(包括SiO3-Si/NO3-N、PO4-P/NO3-N、NH4-N/NO3-N摩尔比值)。与同时期在徐六泾和长江口的测定结果相比, 东海东北部站点A表层的SiO3-Si/NO3-N摩尔比值明显降低(图 8a), 说明在表层长江冲淡水传递过程中SiO3-Si浓度下降速度更快。尽管两个航次站点A表层NO3-N浓度差别较大(图 4), 但SiO3-Si/NO3-N摩尔比值在两个航次间差别并不大, 分别为0.32(2010年7月)和0.34(2011年7月)(图 8a)。与长江淡水端元和长江口相比, 站点A的PO4-P/NO3-N摩尔比值也明显降低(图 8b)。
 |
| 图 8 2010年夏季和2011年夏季表层水体中营养盐摩尔比值的平均值(±标准偏差)在长江淡水端元(徐六泾)、长江口、以及东海东北部的比较 Fig. 8 Comparison of the average molecular ratios of nutrients in the surface waters (including SiO3-Si/NO3-N, PO4-P/NO3-N, and NH4-N/NO3-N) among different regions along the Changjiang River transport pathways in summer 注:长江淡水端元的结果由2010年7月和8月两次采集结果平均得到。2010年8月和2011年8月长江口5个采样站位见图 1a, 2010年8月这5个采样点表层平均盐度为22.3±5.8, 2011年8月为25.0±2.0。东海东北部站点A在2010年7月和2011年7月的表层盐度分别为19.1和22.3, 站点A位置见图 1 |
与长江淡水端元相比, 夏季无论是长江口还是站点A, NH4-N/NO3-N摩尔比值明显升高(图 8c)。事实上不仅是NH4-N/NO3-N摩尔比值, 夏季沿长江冲淡水传输路径NH4-N浓度随着盐度的升高也在逐渐升高(Gao et al, 2015)。以上结果说明长江冲淡水中NH4-N和NO3-N经历了很不相同的生物地球化学过程:前者在不断地被释放, 而后者处在浓度逐渐下降的状态。前面已经提及, 研究区域表层乃至整个水体在2011年7月的NH4-N浓度大大低于2010年7月(图 5, 7), 而较高NO3-N浓度(如 > 15μmol/L)的长江冲淡水的扩散范围在2011年7月又明显大于2010年7月(图 4, 6), 更加剧了两个航次间站点A表层NH4-N/NO3-N摩尔比值的差值(图 8c, 分别是2010年7月的0.26和2011年7月的0.11)。这些现象之后NH4-N和NO3-N之间可能存在的相互转换机制(如硝化过程)值得进一步研究。
3.2 跃层和SCM层对营养盐垂直剖面的控制研究区域夏季海水层化明显, 以温度、盐度跃层为界, 海水事实上沿垂直方向形成两个相对独立的系统, 并通过生物地球化学作用进一步阻隔了各种物质(包括营养盐)在两个系统之间的物理交换。因此, 同一站点温度、盐度跃层上下各种营养盐往往存在很不同的浓度及垂直变化剖面, 并形成了与之相伴而生的SCM层(图 3)。在研究区域, 含有较高营养盐浓度的长江冲淡水有可能上覆于海水表层, 造成营养盐的垂直剖面表现为表层浓度最高; 但如果长江冲淡水的控制较弱, 或表层浮游植物吸收作用较强, 营养盐浓度垂直剖面就可能表现为由上至下逐渐升高的特征(图 6)。温盐跃层和SCM层的存在会使上述营养盐的垂直变化更加复杂, 对研究区域各种生源要素的传递和收支起着非常重要的作用(Siswanto et al, 2005)。
以受到长江冲淡水影响最为明显的站点A为例(图 9), 无论在2010年7月还是在2011年7月, 跃层和SCM层附近以下大部分营养盐浓度都呈现出总体升高或相对稳定的特征。在温度、盐度跃层和SCM层之上, NO3-N和NO2-N表现为浓度由上到下急剧降低, 2011年7月在SCM层附近它们浓度甚至接近或低于检出限(图 9)。在受到长江冲淡水影响较小、水深790m的站点B(图 10), 2011年7月表层除NH4-N外其余四种营养盐浓度均接近或低于检出限。站点B中SCM层附近NO2-N浓度表现为明显升高(图 10b), 而相反的趋势却在同一航次站点A中观测到(图 9d), 这说明SCM层在不同站点对同一营养盐垂直剖面造成的影响可能是完全不同的。站点B中表层浓度很低的NO3-N、SiO3-Si、PO4-P在SCM层之下表现为浓度缓慢升高的趋势, 直至水深600m左右其浓度才保持相对稳定(图 10b)。NH4-N在2011年站点B整个深度没有显示出明显的变化特征, 其浓度范围为3.8–4.5μmol/L(图 10b)。
 |
| 图 9 两个航次站点A的CTD参数(包括温度、盐度、海水密度、荧光强度)和营养盐的垂直剖面 Fig. 9 Vertical profiles of parameters obtained from CTD (including temperature, salinity, seawater density, and fluorescence intensity) and nutrient concentrations at Station A during the two cruises |
 |
| 图 10 2011年7月航次站点B的CTD参数(包括温度、盐度、海水密度、荧光强度)和营养盐的垂直剖面 Fig. 10 Vertical profiles of parameters obtained from CTD (including temperature, salinity, seawater density, and fluorescence intensity) and nutrient concentrations at Station B during the July 2011 cruise |
2011年7月航次站点B最底层600—800m三个采样点温度范围为6.0—6.7℃、盐度范围为34.37— 34.38(图 10a)。根据Gong等(1996)和Ichikawa等(2000), 该处水团主要为KSSW或KIW, 这些水团在研究区域附近由陆坡向陆架涌升(Chen et al, 1994)。Chen(1996)在东海箱式收支模型的计算中, 设定KIW中NO3-N、SiO3-Si、PO4-P的浓度分别25、60、1.7μmol/L, 他们的结果表明, KIW是东海陆架营养盐的最主要来源。Ren等(2006)报道黑潮控制站点(28.17°N, 127.80°E)底部1000m左右SiO3-Si浓度甚至超过120μmol/L。Zhang等(2007)也发现了KSSW和KIW中均存在较高浓度的NO3-N、SiO3-Si、PO4-P等营养盐。
站点B水深600—800m三个采样处NO3-N、SiO3-Si、PO4-P浓度分别在33.9—35.5、83.2—91.0、3.1—3.2μmol/L之间, 高于两个航次其他所有站点整个深度采集的样品中的营养盐浓度(包括受长江冲淡水控制最为明显的站点A的表层)。PO4-P在这三个黑潮端元样品中的浓度甚至超过其在长江淡水端元的浓度(如2009年9月至2010年8月间浓度变化范围约为0.5—2.5μmol/L, 见Gao et al, 2012)。以上结果说明, 黑潮水团可能是研究区域营养盐的一个非常重要的提供者; 而长江冲淡水的影响可能仅仅局限在东海西侧部分区域。KSSW和KIW等黑潮水团自底层向上侵入到东海东北部的过程中, 其中的营养盐浓度也在逐步变化, 表现为研究区域底层这些营养盐中部浓度往往较低、东侧受黑潮控制的水团中浓度往往较高(NO3-N的结果见图 6, 如果考虑到站点B的结果, 这一趋势将更加明显)。
4 结论通过2010年7月和2011年7月在东海东北部两个航次的调查结果, 发现夏季研究区域均处在海水层化状态, 在径流量较大的2010年7月, 上覆于海水表层的长江冲淡水(盐度 < 31) 在研究区域的扩散范围明显大于2011年7月, 但是含有高NO3-N浓度(如 > 15μmol/L)长江冲淡水却在2011年7月的扩散范围更大。除了受到长江冲淡水影响较大的站点, 由于表层浮游植物吸收等因素的影响, NO3-N、SiO3-Si、PO4-P在各站点的垂直剖面一般显示出在温盐跃层和SCM层以上浓度很低, 而在温盐跃层和SCM层以下其浓度快速升高并逐渐稳定的趋势。NH4-N在两个航次的各站点其浓度沿垂直方向相对稳定, 并且研究区域其在各个站点整个深度的浓度在2010年7月明显高于2011年7月。与同时期在长江淡水端元和长江口的观测结果相比, 长江冲淡水影响到的东海东北部站点表层SiO3-Si/NO3-N和PO4-P/NO3-N摩尔比值明显偏低, 说明与NO3-N相比, 沿着长江冲淡水的传输路径SiO3-Si和PO4-P的浓度下降速度更快。研究区域KSSW和KIW水团中NO3-N、SiO3-Si、PO4-P浓度接近甚至超过他们在长江淡水端元中的浓度, 上述黑潮水团可能构成东海东北部营养盐的一个非常重要的来源。
致谢 感谢长崎丸号调查船船长和船员在航次期间采样过程中提供的帮助, 感谢航次首席科学家Joji Ishizaka教授提供CTD数据。
参考文献
| 毛汉礼, 甘子钧, 蓝淑芳, 1963. 长江冲淡水及其混合问题的初步探讨. 海洋与湖沼, 5(3): 183–206 |
| 水利部长江水利委员会, 2011. 长江泥沙公报2010. 武汉: 长江出版社, 1-62 |
| 水利部长江水利委员会, 2012. 长江泥沙公报2011. 武汉: 长江出版社, 1-43 |
| 赵保仁, 1991. 长江冲淡水的转向机制问题. 海洋学报, 13(5): 600–610 |
| Beardsley R C, Limeburner R, Yu H, et al, 1985. Discharge of the Changjiang (Yangtze River) into the East China Sea. Continental Shelf Research, 4(1-2): 57–76 DOI:10.1016/0278-4343(85)90022-6 |
| Chai C, Yu Z M, Shen Z L, et al, 2009. Nutrient characteristics in the Yangtze River Estuary and the adjacent East China Sea before and after impoundment of the Three Gorges Dam. Science of the Total Environment, 407(16): 4687–4695 DOI:10.1016/j.scitotenv.2009.05.011 |
| Chang P H, Isobe A, 2003. A numerical study on the Changjiang diluted water in the Yellow and East China Seas. Journal of Geophysical Research Atmospheres, 108(C9): 3299 DOI:10.1029/2002JC001749 |
| Chang P H, Isobe A, Kang K R, et al, 2014. Summer behavior of the Changjiang diluted water to the East/Japan Sea:A modeling study in 2003. Continental Shelf Research, 81: 7–18 DOI:10.1016/j.csr.2014.03.007 |
| Chen C S, Beardsley R C, Limeburner R, et al, 1994. Comparison of winter and summer hydrographic observations in the Yellow and East China Seas and adjacent Kuroshio during 1986. Continental Shelf Research, 14(7-8): 909–929 DOI:10.1016/0278-4343(94)90079-5 |
| Chen C S, Xue P F, Ding P X, et al, 2008. Physical mechanisms for the offshore detachment of the Changjiang Diluted Water in the East China Sea. Journal of Geophysical Research, 113(C2): C02002 DOI:10.1029/2006JC003994 |
| Chen C T A, 1996. The Kuroshio intermediate water is the major source of nutrients on the East China Sea continental shelf. Oceanologica Acta, 19(5): 523–527 |
| Gao L, Li D J, Ishizaka J, et al, 2015. Nutrient dynamics across the river-sea interface in the Changjiang (Yangtze River) Estuary-East China Sea region. Limnology and Oceanography, 60(6): 2207–2221 DOI:10.1002/lno.10196 |
| Gao L, Li D J, Zhang Y W, 2012. Nutrients and particulate organic matter discharged by the Changjiang (Yangtze River):Seasonal variations and temporal trends. Journal of Geophysical Research, 117(G4): G04001 DOI:10.1029/2012JG001952 |
| Gong G C, Chang J, Chiang K P, et al, 2006. Reduction of primary production and changing of nutrient ratio in the East China Sea:Effect of the Three Gorges Dam?. Geophysical Research Letters, 33(7): L07610 DOI:10.1029/2006GL025800 |
| Gong G C, Chen Y L, Liu K K, 1996. Chemical hydrography and chlorophyll a distribution in the East China Sea in summer:implications in nutrient dynamics. Continental Shelf Research, 16: 1561–1590 DOI:10.1016/0278-4343(96)00005-2 |
| Hama T, Shin K H, Handa N, 1997. Spatial variability in the primary productivity in the East China Sea and its adjacent waters. Journal of Oceanography, 53(1): 41–51 DOI:10.1007/BF02700748 |
| Ichikawa H, Beardsley R C, 2002. The current system in the Yellow and East China Seas. Journal of Oceanography, 58(1): 77–92 DOI:10.1023/A:1015876701363 |
| Ichikawa H, Chaen M, 2000. Seasonal variation of heat and freshwater transports by the Kuroshio in the East China Sea. Journal of Marine Systems, 24(1-2): 119–129 DOI:10.1016/S0924-7963(99)00082-2 |
| Isobe A, Ando M, Watanabe T, et al, 2002. Freshwater and temperature transports through the Tsushima-Korea Straits. Journal of Geophysical Research, 107(C7): 3065 DOI:10.1029/2000JC000702 |
| Isobe A, Matsuno T, 2008. Long-distance nutrient-transport process in the Changjiang river plume on the East China Sea shelf in summer. Journal of Geophysical Research, 113(C4): C04006 DOI:10.1029/2007JC004248 |
| Jiao N Z, Zhang Y, Zeng Y H, et al, 2007. Ecological anomalies in the East China Sea:Impacts of the Three Gorges Dam?. Water Research, 41(6): 1287–1293 DOI:10.1016/j.watres.2006.11.053 |
| Kanda J, Itoh T, Ishikawa D, et al, 2003. Environmental control of nitrate uptake in the East China Sea. Deep Sea Research Part Ⅱ:Topical Studies in Oceanography, 50(2): 403–422 DOI:10.1016/S0967-0645(02)00464-2 |
| Lee H J, Chao S Y, 2003. A climatological description of circulation in and around the East China Sea. Deep Sea Research Part Ⅱ:Topical Studies in Oceanography, 50(6-7): 1065–1084 DOI:10.1016/S0967-0645(03)00010-9 |
| Lie H J, Cho C H, Lee J H, et al, 2003. Structure and eastward extension of the Changjiang River plume in the East China Sea. Journal of Geophysical Research, 108(C3): 3077 DOI:10.1029/2001JC001194 |
| Liu S M, Qi X H, Li X N, et al, 2016. Nutrient dynamics from the Changjiang (Yangtze River) estuary to the East China Sea. Journal of Marine Systems, 154: 15–27 DOI:10.1016/j.jmarsys.2015.05.010 |
| Moon J H, Hirose N, Yoon J H, et al, 2010. Offshore detachment process of the low-salinity water around Changjiang Bank in the East China Sea. Journal of Physical Oceanography, 40(5): 1035–1053 DOI:10.1175/2010JPO4167.1 |
| Moon J H, Pang I C, Yoon J H, 2009. Response of the Changjiang diluted water around Jeju Island to external forcings:A modeling study of 2002 and 2006. Continental Shelf Research, 29(13): 1549–1564 DOI:10.1016/j.csr.2009.04.007 |
| Morimoto A, Takikawa T, Onitsuka G, et al, 2009. Seasonal variation of horizontal material transport through the eastern channel of the Tsushima Straits. Journal of Oceanography, 65(1): 61–71 DOI:10.1007/s10872-009-0006-z |
| Ren J L, Zhang J, Li J B, et al, 2006. Dissolved aluminum in the Yellow Sea and East China Sea-Al as a tracer of Changjiang (Yangtze River) discharge and Kuroshio incursion. Estuarine, Coastal and Shelf Science, 68(1-2): 165–174 DOI:10.1016/j.ecss.2006.02.004 |
| Sasaki H, Siswanto E, Nishiuchi K, et al, 2008. Mapping the low salinity Changjiang Diluted Water using satellite-retrieved colored dissolved organic matter (CDOM) in the East China Sea during high river flow season. Geophysical Research Letters, 35(4): L04604 DOI:10.1029/2007GL032637 |
| Senjyu T, Enomoto H, Matsuno T, et al, 2006. Interannual salinity variations in the Tsushima Strait and its relation to the Changjiang discharge. Journal of Oceanography, 62(5): 681–692 DOI:10.1007/s10872-006-0086-y |
| Shan F, Qiao F L, Xia C S, 2009. A numerical study of summertime expansion pattern of Changjiang (Yangtze) River diluted water. Acta Oceanologica Sinica, 28(3): 11–16 |
| Shi W, Wang M H, 2009. Green macroalgae blooms in the Yellow Sea during the spring and summer of 2008. Journal of Geophysical Research, 114(C12): C12010 DOI:10.1029/2009JC005513 |
| Siswanto E, Ishizaka J, Yokouchi K, 2005. Estimating Chlorophyll-a vertical profiles from satellite data and the implication for primary production in the Kuroshio front of the East China Sea. Journal of Oceanography, 61(3): 575–589 DOI:10.1007/s10872-005-0066-7 |
| Siswanto E, Nakata H, Matsuoka Y, et al, 2008. The long-term freshening and nutrient increases in summer surface water in the northern East China Sea in relation to Changjiang discharge variation. Journal of Geophysical Research, 113(C10): C10030 DOI:10.1029/2008JC004812 |
| Wang B D, 2006. Cultural eutrophication in the Changjiang (Yangtze River) plume:History and perspective. Estuarine, Coastal and Shelf Science, 69(3-4): 471–477 DOI:10.1016/j.ecss.2006.05.010 |
| Wang S Q, Ishizaka J, Yamaguchi H, et al, 2014. Influence of the Changjiang River on the light absorption properties of phytoplankton from the East China Sea. Biogeosciences, 11(7): 1759–1773 DOI:10.5194/bg-11-1759-2014 |
| Wang W S, 1988. Yangtze Brackish water plume-circulation and diffusion. Progress in Oceanography, 21(3-4): 373–385 DOI:10.1016/0079-6611(88)90015-8 |
| Wang Z L, Xiao J, Fan S L, et al, 2015. Who made the world's largest green tide in China?-an integrated study on the initiation and early development of the green tide in Yellow Sea. Limnology and Oceanography, 60(4): 1105–1117 DOI:10.1002/lno.10083 |
| Xian W W, Kang B, Liu R Y, 2005. Jellyfish blooms in the Yangtze Estuary. Science, 307(5760): 41 |
| Xu Y J, Ishizaka J, Yamaguchi H, et al, 2013. Relationships of interannual variability in SST and phytoplankton blooms with giant jellyfish (Nemopilema nomurai) outbreaks in the Yellow Sea and East China Sea. Journal of Oceanography, 69(5): 511–526 DOI:10.1007/s10872-013-0189-1 |
| Yan W J, Mayorga E, Li X Y, et al, 2010. Increasing anthropogenic nitrogen inputs and riverine DIN exports from the Changjiang River basin under changing human pressures. Global Biogeochemical Cycles, 24(4): GB0A06 DOI:10.1029/2009GB003575 |
| Zhang J, Liu S M, Ren J L, et al, 2007. Nutrient gradients from the eutrophic Changjiang (Yangtze River) Estuary to the oligotrophic Kuroshio waters and re-evaluation of budgets for the East China Sea Shelf. Progress in Oceanography, 74(4): 449–478 DOI:10.1016/j.pocean.2007.04.019 |
| Zhou M J, Shen Z L, Yu R C, 2008. Responses of a coastal phytoplankton community to increased nutrient input from the Changjiang (Yangtze) River. Continental Shelf Research, 28(12): 1483–1489 DOI:10.1016/j.csr.2007.02.009 |