
中国海洋湖沼学会主办。
文章信息
- 白美娜, 江涛, 陈飞羽, 王朝晖, 江天久. 2019.
- BAI Mei-Na, JIANG Tao, CHEN Fei-Yu, WANG Zhao-Hui, JIANG Tian-Jiu. 2019.
- 大亚湾大鹏澳牡蛎养殖临近海域自养微微型浮游生物种群分布特征
- THE TEMPORAL AND SPATIAL DISTRIBUTION OF AOTOTROPHIC PICOPLANKTON AND COMMUNITY IN THE OYSTER CULTURE AREA AND ITS ADJACENT WATERS OF DAPENG COVE, GUANGDONG, CHINA
- 海洋与湖沼, 50(1): 129-138
- Oceanologia et Limnologia Sinica, 50(1): 129-138.
- http://dx.doi.org/10.11693/hyhz20180700162
-
文章历史
- 收稿日期:2018-07-05
- 收修改稿日期:2018-09-08
2. 农业部海洋渔业可持续发展重点实验室 中国水产科学研究院黄海水产研究所 青岛 266071;
3. 水生生物研究所 暨南大学 广州 510632
2. Key Laboratory of Sustainable Development of Marine Fisheries, Ministry of Agriculture Yellow Sea Fisheries Research Institute, Chinese Academy of Fishery Sciences, Qingdao 266071, China;
3. Research Center for of Hydrobiology, Jinan University, Guangzhou 510632, China
浮游植物是海洋食物链的主要初级生产者, 其生产力约占海洋生态系统总生产力的95% (Reynolds, 1984)。贝类作为海湾生态系统的重要类群, 通常以浮游植物、腐质和一定粒径的浮游动物作为饵料来源, 其中浮游植物是主要摄食对象(Navarro et al, 1996; Riisgård et al, 2001; Lehane et al, 2006)。不同种类和大小的贝类可以选择性摄食不同种类的藻类(王芳等, 2000)。有研究表明牡蛎对微型颗粒(> 3μm)的滤食率较低(> 50%)(Deslous-Paoli et al, 1987), 而能够完全滤食大于7μm的颗粒(Riisgård, 1988)。Cranford等(2011)也证实双壳贝类的腮对微微型浮游植物的滤食率很低。贝类养殖会影响浮游植物群落结构, 反之浮游植物也能影响贝类的产量(郭皓等, 1999)。Cloern(1982)发现在旧金山湾贝类摄食影响小型和微型浮游植物生物量, Petersen等(2008)研究也证实了贝类筏式养殖区周围水体的小型和微型浮游植物和腐质密度显著降低, 而微微型浮游生物会因为贝类滤食其竞争者和捕食者, 而在贝类养殖区繁盛(Cranford et al, 2011)。
自养微微型浮游生物(aototrophicpicoplankton, APP)具有体积小和比表面积高的特点, 从而具有高营养吸收率和高生长率; 其分布广泛, 对全球海洋的初级生产力贡献很大(Massana, 2011)。许多微微型浮游植物因形体和形态学特征不明显, 传统经典分类法难以对其进行准确的定性定量分析。流式细胞技术可依据色素所发出的不同荧光, 将APP分为原绿球藻、聚球藻和真核浮游生物三类, 但难以对浮游植物进一步地进行分类鉴定。分子技术引入海洋生态学研究以来, DNA水平的研究已经深入到微微型浮游生物的研究中, 提供了不依赖于形态学的分类指标, 成为浮游植物分类鉴定的有效方法。但是, 目前分子生物学方法在天然水体浮游植物定量分析和批量样品的快速处理方面具有一定的难度。色素化学分类法易操作、准确性高, 可以实现样品批量测定, 对部分浮游植物可以鉴定到藻纲以下的分类级别, 不受浮游藻粒径和形态的影响, 在浮游植物检测方面具有明显的优势。例如, 基于特征色素二乙烯基叶绿素a和b (Divinyl chlorophyll a和b)的流式细胞技术, Chisholm等(1988)首次发现了原绿球藻(Prochlorococcus)广泛存在于大洋中; Yu等(2007)在胶州湾检测出青绿藻黄素(Prasinoxanthin)等特征色素, 证实了我国海域存在微微型青绿藻。Mackey等(1996)利用不同门(或纲)色素比值的差异, 从估计的藻类初始色素比值出发, 建立了计算浮游藻类各类群生物量的矩阵因子化程序(即CHEMTAX), 从而将HPLC分析所得的原始色素数据对不同门类浮游植物进行定性定量分析。目前, 基于CHEMTAX对浮游植物群落结构的研究已广泛应用于全球多个海域(Gonalves-Araujo et al, 2018; Mendes et al, 2018; Wang et al, 2018), 但针对APP的定性定量研究尚比较少(郑耀洋, 2016; Tamm et al, 2018), 尤其在贝类养殖海域对APP的研究尤为少见。
大亚湾是南海北部的重要海湾, 是广东省重要的水产养殖海域。近几十年来, 大亚湾海域环境质量受人类活动影响显著, 该海域水体温度和营养盐浓度上升明显, 浮游植物种群结构发生了甲藻向硅藻种群演变的趋势(Li et al, 2011)。Wang等(2018)采用CHEMTAX分析了大亚湾浮游植物种群结构特征, 但有关微微型浮游植物种群时空分布的研究尚未开展。本课题组前期的研究表明, 大亚湾大鹏澳海域微微型浮游植物中检出了15种光合色素, 其中包括了8种特征色素(Jiang et al, 2016), 这表明该海域微微型浮游植物具有较高的丰富度。于宗赫等(2014)研究表明, 近年来大鹏澳海域牡蛎养殖数量显著增加, 其生长速度比以前降低, 牡蛎养殖已显著影响了水体中浮游植物种群结构特征(张玲等, 2015)。然而有关大鹏澳牡蛎养殖区及邻近海域APP种群结构及时空分布的定量研究尚未见报道。为了定量描述该海域不同门类微微型浮游植物的生物量, 本研究采用光合色素化学分类CHEMTAX法进行计算, 以期揭示该海域不同门类微微型浮游植物的时空变化特征, 为我国海域的微微型浮游植物和贝类养殖的环境影响等方面的研究提供借鉴。
1 材料及方法 1.1 站位设置与样品采集大亚湾大鹏澳位于大亚湾西南侧, 为半封闭型溺谷湾, 总面积约为45km2, 非常适合海产品养殖, 包括延绳式平挂的方式吊养葡萄牙牡蛎和网箱养鱼两种类型。本研究在大鹏澳设置4个采样点ST1(渔排养殖区)、ST2(牡蛎养殖区)、ST3(位于湾口, 受养殖区影响较小)、ST4(湾外, 即对照点)(图 1)。采样时间为2013年5月到2014年6月, 其中5—8月为牡蛎非养殖期, 9—4月为牡蛎养殖期(表 2)。
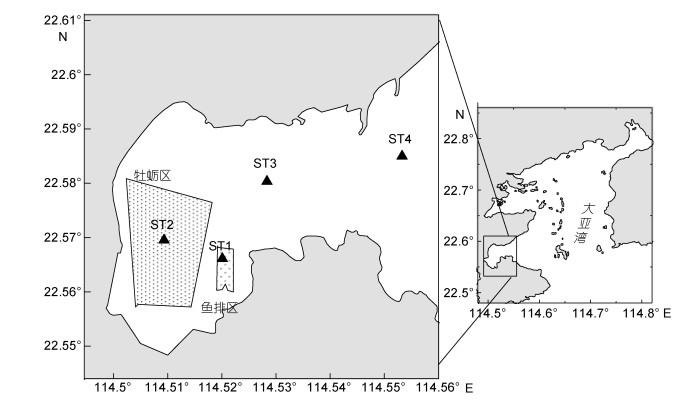 |
| 图 1 广东省大亚湾大鹏澳海域采样站位图 Fig. 1 Map of sampling stations in Dapeng Cove, Guangdong, South China |
| 理化指标 | 牡蛎养殖期(9—4月) | 非牡蛎养殖期(5—8月) | |||||||
| ST1 | ST2 | ST3 | ST4 | ST1 | ST2 | ST3 | ST4 | ||
| 温度(℃) | 21.03±4.93a | 21.11±5.07a | 21.54±5.01a | 21.71±5.01a | 29.45±1.66a | 29.40±1.43a | 29.82±1.68a | 30.20±1.67a | |
| 盐度(μmol/L) | 32.22±1.51a | 32.33±1.37a | 32.68±1.18a | 32.86±1.05a | 28.38±1.63a | 28.17±1.83a | 28.66±2.39a | 29.17±2.12a | |
| DIN (μmol/L) | 12.65±7.21a | 11.50±4.35a | 8.37±4.30a | 9.89±3.54a | 18.44±5.78a | 17.61±6.77a | 14.27±5.32a | 13.19±6.18a | |
| DIP (μmol/L) | 0.27±0.18a | 0.36±0.17a | 0.19±0.22a | 0.30±0.18a | 0.16±0.11a | 0.17±0.09a | 0.20±0.23a | 0.30±0.25a | |
| DSi (μmol/L) | 25.51±16.21a | 25.58±16.12a | 20.66±17.2a | 25.39±21.54a | 19.55±15.83a | 17.95±14.59a | 13.80±10.71a | 11.34±7.49a | |
| 青绿藻(ng/L chl a) | 17.96±30.47a | 16.59±17.68a | 2.88±3.45a | 3.90±3.41a | 5.94±5.12a | 5.98±8.33a | 6.50±8.43a | 5.15±6.13a | |
| 硅藻(ng/L chl a) | 5.83±11.07a | 4.92±4.44a | 11.12±13.8a | 6.27±4.50a | 11.82±10.21a | 14.39±16.62a | 11.03±13.92a | 8.50±5.98a | |
| 蓝藻(ng/L chl a) | 12.16±16.79a | 6.83±9.56a | 7.94±12.41a | 11.31±21.89a | 24.84±24.03a | 21.99±33.35a | 39.59±51.49a | 40.91±57.31a | |
| 隐藻(ng/L chl a) | 72.85±61.47a | 66.59±47.93a | 134.88±131.95a | 90.43±43.57a | 70.22±49.00a | 77.64±45.17a | 52.29±29.23a | 87.15±43.07a | |
| 定鞭藻(ng/L chl a) | 47.42±66.63a | 52.09±90.03a | 34.29±48.29a | 62.18±84.39a | 36.54±58.03a | 27.04±52.4a | 23.76±47.29a | 30.61±25.45a | |
| chl a (ng/L) | 51.33±77.08a | 35.30±30.67a | 28.16±28.54a | 26.88±28.6a | 54.27±30.13a | 54.41±70.35a | 74.50±90.90a | 66.68±73.91a | |
| Fuco (ng/L) | 26.12±21.74b | 29.04±19.37b | 72.57±64.21a | 33.27±20.15b | 52.25±30.47a | 71.38±32.05a | 54.57±50.68a | 40.52±16.87a | |
| Pras (ng/L) | 40.98±40.67a | 41.15±30.90a | 11.11±13.95b | 10.76±11.67b | 9.11±7.31a | 8.23±6.53a | 6.68±6.57a | 6.47±7.04a | |
| Zea (ng/L) | 62.2±89.33a | 32.84±42.73a | 41.71±60.21a | 36.91±49.95a | 139.75±131.32a | 92.14±91.01a | 132.96±142.57a | 181.96±241.21a | |
| 注: DIN:溶解无机氮; DIP:溶解无机磷; DSi:溶解态硅; chl a:叶绿素a; Fuco:岩藻黄素; Pras:青绿藻素; Zea:玉米黄素。a, b, c不同字母之间表示存在显著性差异 | |||||||||
用有机玻璃采水器采集0.5m深海水样品4L, 经200μm的筛绢预过滤后, 依次用20μm尼龙滤膜、2.7μm玻璃纤维膜(GF/D)、0.7μm玻璃纤维膜(GF/F)在过滤压小于0.03MPa条件下进行分级过滤, 以收集不同粒径的浮游植物, 将滤膜置于液氮罐中带回实验室, 并转移至-80℃冰箱中保存待HPLC分析。本文仅针对GF/F膜(0.7—2.7μm)粒径范围内浮游植物(即微微型浮游植物)进行CHEMTAX分析。过滤后的水样冰冻保存, 用于测定营养盐。水体温度、盐度等指标采用YSI (6600, 美国)现场测定。
1.2 研究方法 1.2.1 微微型浮游植物的光合色素分析在低温弱光环境下, 将置于-80℃冰箱的海水滤膜取出并剪碎, 加入3mL 95%的甲醇萃取(冰浴超声5min), 采用0.45μm尼龙膜过滤用于HPLC分析。光合色素HPLC分析方法参照Zapata等(2000)。HPLC分析采用Agilent 1200系列, 配置1315C二极管阵列检测器, 于440nm波长条件下检出色谱峰。色素标准品包括8种叶绿素类: Mg DVP、二乙烯基叶绿素a (DV chl a)、脱镁叶绿酸a (Pheide a)、脱镁叶绿素a (Phe a)、叶绿素类a (chl a)、chl b、chl c2、chl c3;光合类胡萝卜素5种:岩藻黄素(Fuco)、19’-己酰基氧化岩藻黄素(Hex-Fuco)、β-胡萝卜素(β, β-Car)、多甲藻素(Peri)、19’-丁酰基氧化岩藻黄素(But-Fuco); 光保护类胡萝卜素9种:硅甲藻黄素(Diadino)、别藻黄素(Allo)、硅藻黄素(Diato)、叶黄素(Lut)、甲藻黄素(Dino)、紫黄质(Viola)、新黄素(Neo)、玉米黄素(Zea)和青绿黄素(Pras); 共22种, 由丹麦DHI公司生产。
1.2.2 光合色素CHEMTAX分析本研究使用CHEMTAX程序因子分析方法对浮游植物色素进行分析。分析了8种浮游植物类群对chl a的贡献(浮游植物类群包括):硅藻(Diatoms)、甲藻(Dinoflagellates)、蓝藻(Cyanobacteria)、青绿藻(Prasinophytes)、隐藻(Cryptophytes)、绿藻(Chlorophytes)、定鞭藻(Haptophytes)和金藻(Chrysophytes)。CHEMTAX分析初始输入矩阵主要参考了Mackey等(1996)、Lohrenz等(2003)和Wang等(2015)的方法, 见表 1。
| 浮游植物类群 | Peri | But-Fuco | Fuco | Hex-Fuco | Neo | Pras | Viola | Allo | Lut | Zea | chl b | chl a |
| 青绿藻 | 0 | 0 | 0 | 0 | 0.15 | 0.32 | 0.06 | 0 | 0.01 | 0 | 0.95 | 1 |
| 硅藻 | 0 | 0 | 0.75 | 0 | 0 | 0 | 0 | 0 | 0 | 0 | 0 | 1 |
| 甲藻 | 1.06 | 0 | 0 | 0 | 0 | 0 | 0 | 0 | 0 | 0 | 0 | 1 |
| 蓝藻 | 0 | 0 | 0 | 0 | 0 | 0 | 0 | 0 | 0 | 1.2 | 0 | 1 |
| 定鞭藻 | 0 | 0.02 | 0.05 | 1.2 | 0 | 0 | 0 | 0 | 0 | 0 | 0 | 1 |
| 绿藻 | 0 | 0 | 0 | 0 | 0.06 | 0 | 0.06 | 0 | 0.2 | 0.01 | 0.26 | 1 |
| 隐藻 | 0 | 0 | 0 | 0 | 0 | 0 | 0 | 0.23 | 0 | 0 | 0 | 1 |
| 金藻 | 0 | 1.3 | 0.2 | 0.01 | 0 | 0 | 0 | 0 | 0 | 0 | 0 | 1 |
水体理化特征和色素单因素方差分析采用SPSS17.0完成。以CHEMTAX运算结果为物种数据, 采用CANOCO 4.5, 与水体理化特征值进行冗余(RDA)分析。
2 结果 2.1 水体主要理化指标大亚湾表层水体物理化学指标的时空分布特征如图 2所示。温度(T)、盐度(S)和溶解氧(DO)在4个站位之间无显著性差异(P > 0.05), 均呈现出冬季低温高盐和夏季高温低盐的特征, DO无明显季节变化特征。牡蛎养殖期(9—4月)主要处于秋冬及初春季节, 水体中具有相对低温和高盐的特点(表 2)。活性磷酸盐(DRP)浓度范围为0—0.76μmol/L, 无机氮(DIN)浓度范围为2.75—28.12μmol/L, 硅酸盐(DSi)浓度范围为2.76—49.54μmol/L, 4个站位之间的营养盐数据没有显著性差异(P > 0.05)(图 2, 表 2)。但从牡蛎养殖与非养殖两个时间段来看, DIN和DSi在牡蛎养殖期明显高于非养殖期(P < 0.05)(表 2)。
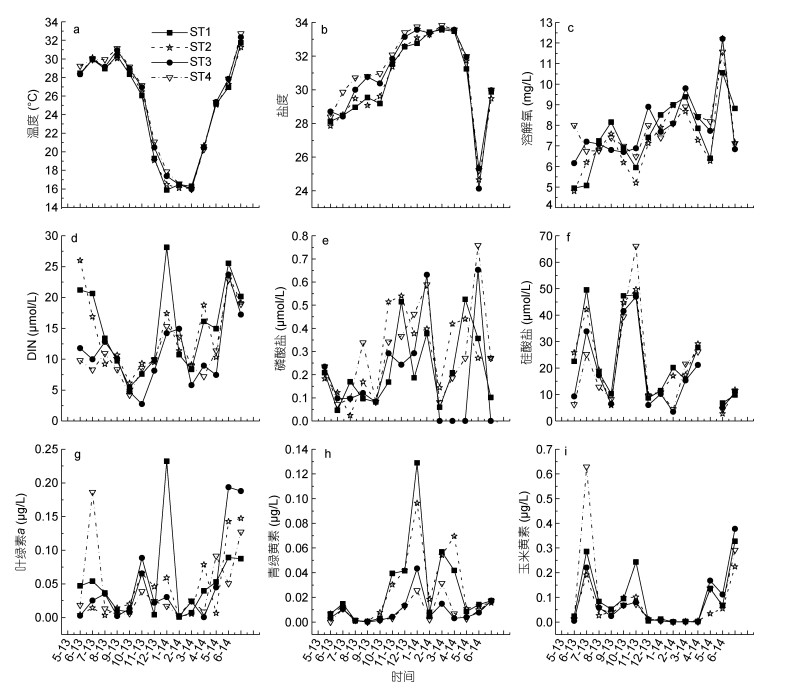 |
| 图 2 大亚湾表层水的温度盐度及营养盐(Jiang et al, 2016)和色素 Fig. 2 Temporal and spatial variations of the environmental parameters (Jiang et al, 2016) and pigments |
HPLC分析共检出微微型色素15种, 包括β-Car、Diat、Diadino、Viola、Neo、Pras、Lut、But-Fuco、Peri、Allo、Hex-Fuco、Fuco、chl b、Zea和chl a。微微型chl a浓度范围为0.60—232.00ng/L, 在牡蛎养殖期间, 呈现出由ST1到ST4逐渐递减的趋势, 在非养殖期间, 则出现相反的变化(表 2)。Pras和Zea是微微型色素中浓度最高的2种特征色素, 均具有明显的季节变化特征: Pra主要出现在低温季节(牡蛎养殖期), 而Zea主要出现在高温季节(非牡蛎养殖期)。Pras浓度最高值出现在12月份ST1 (129.00ng/L)和ST2 (96.00ng/L)。在牡蛎养殖期, 渔排养殖区(ST1)和牡蛎养殖区(ST2)浓度显著高于非养殖区(ST3和ST4)(P < 0.05), 非养殖期则没有出现类似情况(表 2)。
经CHEMTAX分析, 4个站位微微型浮游植物主要类群组成结构如图 3所示。结果表明, 在整个调查期间, 大亚湾微微型浮游植物最主要的类群是硅藻、蓝藻和青绿藻, 而甲藻、隐藻、定鞭金藻、绿藻和金藻生物量较低。青绿藻、甲藻、隐藻、定鞭金藻、绿藻、硅藻、蓝藻、金藻对浮游植物生物量的贡献分别为19.87%、5.74%、4.06%、8.29%、3.15%、29.95%、28.64%、0.30%。
与色素特征相对应, 在牡蛎养殖期间微微型青绿藻在ST1和ST2站位所占比重要高于ST3和ST4站位(表 2, 图 3)。在养殖期, 微微型浮游植物群落中青绿藻在ST1和ST2占绝对优势, 贡献值分别为41.41%、45.86%, 而在ST3和ST4硅藻占主要优势。在非养殖期, 4个站位均表现出蓝藻和硅藻比重明显上升的趋势(图 3, 4)。
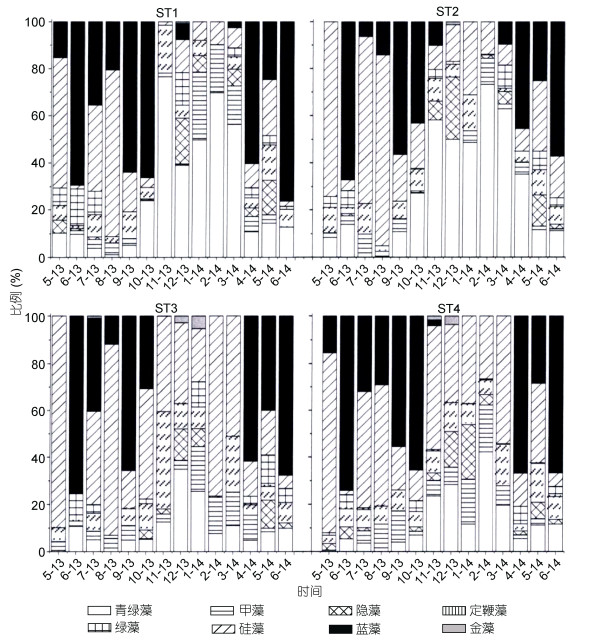 |
| 图 3 各浮游植物功能类群对叶绿素a含量的贡献 Fig. 3 Contributions of various phytoplankton functional groups to chlorophyll a |
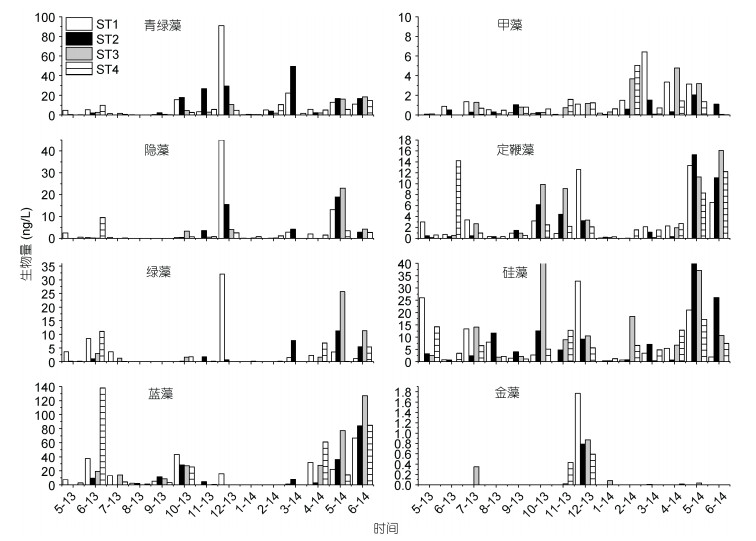 |
| 图 4 8种浮游植物功能群的叶绿素a生物量绝对值 Fig. 4 The absolute of chlorophyll a biomass of eight phytoplankton functional groups |
不同门类浮游植物对chl a的贡献量作为物种数据, 分别在牡蛎养殖期和非养殖期做冗余分析(RDA)。排序结果显示, 在牡蛎养殖期, 微微型青绿藻是优势种, 其分布与DIN和DRP呈现出显著正相关, 同时与养殖区站位(ST1、ST2;名义变量)分布相一致, 而与非养殖区站位分布趋势相反(ST3、ST4)(图 5b)。在非养殖期, 蓝藻和硅藻是优势种, 蓝藻生物量分布与DSi和温度有一定正相关, 硅藻则处于相反方向; 青绿藻依然与DIN表现出正相关(图 5a)。
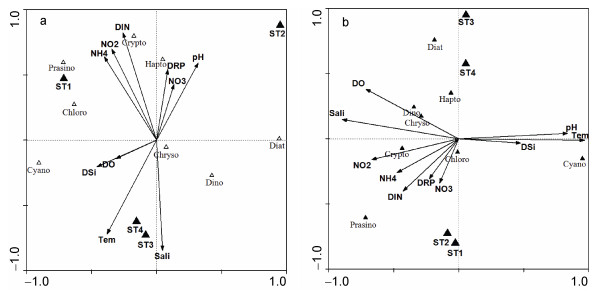 |
| 图 5 大亚湾四个站位RDA排序图 Fig. 5 Ordination diagram of RDA in four stations along the coasts of Daya Bay 注: a.非牡蛎养殖期; b.牡蛎养殖期; Diat:硅藻; Dino:甲藻; Cyano:蓝藻; Prasino:青绿藻; Crypto:隐藻; Chloro:绿藻; Hapto:定鞭藻; Chryso:金藻 |
近年来, 对自养型微微型浮游生物(APP)研究较为集中的海域包括地中海(Bec et al, 2011)、南北极水域(Piquet et al, 2008)、英吉利海峡(Masquelier et al, 2011)、大西洋近岸与外海(Kirkham et al, 2011)、太平洋沿岸及赤道海域(Worden, 2006)、印度洋(Rajaneesh et al, 2017)和我国四大海域(Huang et al, 2009; Zhao et al, 2013, 2016; 郑耀洋, 2016)等。流式细胞技术、分子分类学技术和光合色素化学分类法等有关APP种群结构研究的手段具有不同的研究优势, 能够起到相互补充的作用。目前, 基于CHEMTAX对浮游植物群落结构的研究已广泛应用于全球多个海域, 证实了该法具有良好的应用价值(Mackey et al, 1996)。然而, 以往研究多集中在全粒径浮游植物种群, 针对自养型微微型浮游生物的定性定量研究尚比较少(郑耀洋, 2016; Tamm et al, 2018), 本研究进一步证实了CHEMTAX在APP种群研究中具有较好的应用潜力。
先前研究表明, APP在贫营养海域尤其是大洋海域占较大比重, 其对初级生产力的贡献能够达到50%—90%(Barber, 2007)。相对来讲, 在富营养化海域APP占总浮游植物的比重明显降低, 但其绝对生物量却能够维持在较高水平(Bec et al, 2011; Massana, 2011)。目前大亚湾海域处于中等富营养化水平(Wang et al, 2018)。在大鹏澳海域, 微微型chl a浓度范围为43.00—53.00ng/L(平均值47.00ng/L), 平均值占总chl a的19.7% (Jiang et al, 2016)。光合色素化学分类法(CHEMTAX)分析结果表明, 该海域APP的生物多样性非常高, 包括了青绿藻、甲藻、隐藻、定鞭金藻、绿藻、硅藻、蓝藻、金藻等8个类群, 其中青绿藻和蓝藻是主要的APP种群。与此相似, 陈纪新等(2003)也采用光合色素化学分类法研究了厦门海域超微型浮游植物(< 5μm)种群结构, 发现其主要包括硅藻、定鞭毛藻(定鞭金藻)、绿藻、隐藻、蓝藻等, 但该海域超微型浮游植物主要种群是绿藻门, 这与大亚湾海域存在明显差异。另外, 渤海中部海域APP也包括了8个类群, 其中硅藻、青绿藻和蓝藻是优势种群, 这与本研究比较相似(郑耀洋, 2016)。以上研究表明, 我国近岸海域水体中APP存在着丰富的生物多样性。
但值得注意的是, 先前研究认为微微型浮游植物类群中可能不存在甲藻, 因为已知的甲藻最小粒径大约为5μm (Massana et al, 2004; Massana, 2011)。尽管不能完全排除微微型甲藻的存在, 但造成这种现象的最大可能是分级过滤过程中较大的甲藻细胞破裂, 从而造成微微型浮游植物样品污染(Tamm et al, 2018)。所以本研究不能排除大粒径藻类碎片造成APP定量高估的现象。另外, 在分级过滤过程中, 也可能存在APP在较大粒径滤膜(微型和小型)中被截留的现象, 从而低估了APP生物量。虽然分级过滤可能造成APP定性定量分析过程中存在偏差, 但目前尚没有有效解决方法, 水体分级过滤依然是研究浮游植物粒径分级的主要手段(Guenther et al, 2015; Taniuchi et al, 2017)。
自养型微微型浮游生物在海洋中的分布受环境因素的控制, 诸多研究表明, 温度、盐度、光照、营养盐、水体稳定性和摄食压力是影响微微型浮游植物时空变化的环境控制因素(Bec et al, 2011; Masquelier et al, 2011; 郑耀洋, 2016; Tamm et al, 2018)。本研究发现, 温度和营养盐浓度是影响大鹏澳海域APP的时空分布的重要因素, 青绿藻主要出现在低温季节(主要在冬季牡蛎养殖期间), 且其生物量与DIN呈显著正相关; 而蓝藻则主要出现在高温季节, 与温度呈显著正相关(图 5)。近几十年来, 人类活动造成了近岸海域(如海湾和河口)营养盐浓度快速增加, 从而对海洋生态系统产生影响。在富营养化程度高的近岸海域, 微微型真核浮游植物的生物量可能会远超过微微型原核浮游生物(Calvo-Díaz et al, 2006; Bec et al, 2011)。微微型真核浮游植物在富营养化程度较高的海域具有很高的丰度, 甚至暴发赤潮(褐潮)状态, 如秦皇岛近岸海域抑食金球藻密度达到106cells/mL (张勇等, 2012), 而在贫营养海域其丰度主要集中在103cells/mL (Bec et al, 2011; Massana, 2011)。从全球尺度来讲, 人类活动造成了海洋酸化和温度上升等问题, 导致海洋环境中浮游植物总生物量下降但APP生物量上升的趋势, 从而引起海洋初级生产力的变化(Hoegh-Guldberg et al, 2010)。
4 结论本研究表明, 贝类养殖也是能够影响APP空间分布的重要因素, 在大鹏澳海域牡蛎养殖期间, 青绿藻生物量在养殖区明显高于非养殖海域(表 2, 图 3—5)。浮游植物是双壳贝类的主要饵料来源(Cranford et al, 2011), 双壳贝类能够有差异的选择性摄食浮游植物(Ward et al, 2004)。双壳贝类对浮游植物的摄食行为, 普遍认为小粒径尤其是微微型(pico-, < 2μm)浮游植物难以被贝类的纤毛截留, 粒径差异是影响选择性摄食的主要原因(Cranford et al, 2008)。双壳贝类能够有效的滤除 > 2—8μm的悬浮颗粒物, 这将导致较大粒径的浮游植物被贝类滤食, 而小粒径尤其是微微型(pico-, < 3μm)浮游植物得以存在于水体, 从而导致水体中浮游植物粒径分布发生改变。研究表明, 微微型浮游植物在高密度贝类养殖海域生长旺盛, 生物量明显高于非养殖海域, 这种现象在法国Thau Lagoon、加拿大Tracadie Bay、新西兰Beatrix Bay、加拿大Prince Edward Island海域的贝类养殖区均有报道(Souchu et al, 2001; Cranford et al, 2008; Safi et al, 2010)。由于微微型浮游植物对贝类饵料的贡献很小, 且其对海洋食物链及碳循环方面的贡献均小于微型和小型浮游植物, 因此近岸海域微微型浮游植物的大量增殖可能会影响海洋生态系统平衡。
| 于宗赫, 江涛, 夏建军, 等, 2014. 大鹏澳牡蛎养殖区生态服务价值评估. 水产学报, 38(6): 853–860 |
| 王芳, 董双林, 张硕, 2000. 海湾扇贝和太平洋牡蛎的食物选择性及滤除率的实验研究. 海洋与湖沼, 31(2): 139–144 DOI:10.3321/j.issn:0029-814X.2000.02.005 |
| 张玲, 李政菊, 陈飞羽, 等, 2015. 大鹏澳牡蛎养殖对浮游植物种群结构的影响研究. 海洋与湖沼, 46(3): 549–555 |
| 张勇, 张永丰, 张万磊, 等, 2012. 秦皇岛海域微微型藻华期间叶绿素a分级研究. 生态科学, 31(4): 357–363 DOI:10.3969/j.issn.1008-8873.2012.04.003 |
| 陈纪新, 黄邦钦, 贾锡伟, 等, 2003. 利用光合色素研究厦门海域超微型浮游植物群落结构. 海洋环境科学, 22(3): 16–21 DOI:10.3969/j.issn.1007-6336.2003.03.004 |
| 郑耀洋, 2016.渤海中部海域浮游植物种群结构、光合色素和粒径特征研究.广州: 暨南大学硕士学位论文 |
| 郭皓, 闫启仑, 沈亮夫, 1999. 贝类浮筏养殖区内、外浮游植物生态特征研究. 黄渤海海洋, 17(3): 64–72 |
| Barber R T, 2007. Oceans:picoplankton do some heavy lifting. Science, 315(5813): 777–778 DOI:10.1126/science.1137438 |
| Bec B, Collos Y, Souchu P, et al, 2011. Distribution of picophytoplankton and nanophytoplankton along an anthropogenic eutrophication gradient in French Mediterranean coastal lagoons. Aquatic Microbial Ecology, 63(1): 29–45 DOI:10.3354/ame01480 |
| Calvo-Díaz A, Morán X A G, 2006. Seasonal dynamics of picoplankton in shelf waters of the southern Bay of Biscay. Aquatic Microbial Ecology, 42(2): 159–174 |
| Chisholm S W, Olson R J, Zettler E R, et al, 1988. A novel free-living prochlorophyte abundant in the oceanic euphotic zone. Nature, 334(6180): 340–343 DOI:10.1038/334340a0 |
| Cloern J E, 1982. Does the benthos control phytoplankton biomass in South San Francisco bay?. Marine Ecology Progress Series, 9: 191–202 DOI:10.3354/meps009191 |
| Cranford P J, Li W, Strand et al, 2008. Phytoplankton depletion by mussel aquaculture: high resolution mapping, ecosystem modeling, and potential indicators of ecological carrying capacity. ICES CM |
| Cranford P J, Ward J E, Shumway S E, 2011. Bivalve filter feeding: variability and limits of the aquaculture biofilter. In: Shumway S E ed. Shellfish Aquaculture and the Environment. Oxford, UK: Wiley-Blackwell, 81-124 |
| Deslous-Paoli J M, Héral M, Goulletquer P, et al, 1987. Evolution saisonniere de la filtration de bivalves intertidaux dans des conditions naturelles. Océanis, 13: 575–579 |
| Gonalves-Araujo R, de Souza M S, Tavano V M, et al, 2018. Phyto-and protozooplankton assemblages and hydrographic variability during an early winter survey in the Southern Brazilian Continental Shelf. Journal of Marine Systems, 184: 36–49 DOI:10.1016/j.jmarsys.2018.04.005 |
| Guenther M, Araújo M, Flores-Montes M, et al, 2015. Eutrophication effects on phytoplankton size-fractioned biomass and production at a tropical estuary. Marine Pollution Bulletin, 91(2): 537–547 DOI:10.1016/j.marpolbul.2014.09.048 |
| Hoegh-Guldberg O, Bruno J F, 2010. The impact of climate change on the world's marine ecosystems. Science, 328(5985): 1523–1528 |
| Huang B Q, Lin X J, Hong H S, 2009. Spatial and temporal variations of Synechococcus and picoeukaryotes in the Taiwan Strait, China. Chinese Journal of Oceanology and Limnology, 27(1): 22–30 DOI:10.1007/s00343-009-0022-2 |
| Jiang T, Chen F Y, Yu Z H, et al, 2016. Size-dependent depletion and community disturbance of phytoplankton under intensive oyster mariculture based on HPLC pigment analysis in Daya Bay, South China Sea. Environmental Pollution, 219: 804–814 DOI:10.1016/j.envpol.2016.07.058 |
| Kirkham A R, Jardillier L E, Holland R, et al, 2011. Analysis of photosynthetic picoeukaryote community structure along an extended Ellett Line transect in the northern North Atlantic reveals a dominance of novel prymnesiophyte and prasinophyte phylotypes. Deep Sea Research Part Ⅰ:Oceanographic Research Papers, 58(7): 733–744 DOI:10.1016/j.dsr.2011.05.004 |
| Lehane C, Davenport J, 2006. A 15-month study of zooplankton ingestion by farmed mussels (Mytilus edulis) in Bantry Bay, Southwest Ireland. Estuarine, Coastal & Shelf Science, 67(4): 645–652 |
| Li T, Liu S, Huang L M, et al, 2011. Diatom to dinoflagellate shift in the summer phytoplankton community in a bay impacted by nuclear power plant thermal effluent. Marine Ecology Progress Series, 424: 75–85 DOI:10.3354/meps08974 |
| Lohrenz S E, Carroll C L, Weidemann A D, et al, 2003. Variations in phytoplankton pigments, size structure and community composition related to wind forcing and water mass properties on the North Carolina inner shelf. Continental Shelf Research, 23(14-15): 1447–1464 DOI:10.1016/S0278-4343(03)00131-6 |
| Mackey M D, Mackey D J, Higgins H W, et al, 1996. CHEMTAX-A program for estimating class abundances from chemical markers:Application to HPLC measurements of phytoplankton. Marine Ecology Progress Series, 144: 265–283 DOI:10.3354/meps144265 |
| Masquelier S, Foulon E, Jouenne F, et al, 2011. Distribution of eukaryotic plankton in the English Channel and the North Sea in summer. Journal of Sea Research, 66(2): 111–122 DOI:10.1016/j.seares.2011.05.004 |
| Massana R, 2011. Eukaryotic picoplankton in surface oceans. Annual Review of Microbiology, 65(1): 91–110 DOI:10.1146/annurev-micro-090110-102903 |
| Massana R, Balagué V, Guillou L, et al, 2004. Picoeukaryotic diversity in an oligotrophic coastal site studied by molecular and culturing approaches. FEMS Microbiology Ecology, 50(3): 231–243 DOI:10.1016/j.femsec.2004.07.001 |
| Mendes C R B, Tavano V M, Kerr R, et al, 2018. Impact of sea ice on the structure of phytoplankton communities in the northern Antarctic Peninsula. Deep Sea Research Part Ⅱ:Topical Studies in Oceanography, 149: 111–123 DOI:10.1016/j.dsr2.2017.12.003 |
| Navarro E, Iglesias J I P, Camacho A P, et al, 1996. The effect of diets of phytoplankton and suspended bottom material on feeding and absorption of raft mussels (Mytilus galloprovincialis Lmk). Journal of Experimental Marine Biology & Ecology, 198(2): 175–189 |
| Petersen J K, Nielsen T G, van Duren L, et al, 2008. Depletion of plankton in a raft culture of Mytilus galloprovincialis in Ría de Vigo, NW Spain. I. Phytoplankton. Aquatic Biology, 4(2): 113–125 |
| Piquet M A T, Bolhuis H, Davidson A T, et al, 2008. Diversity and dynamics of Antarctic marine microbial eukaryotes under manipulated environmental UV radiation. FEMS Microbiology Ecology, 66(2): 352–366 DOI:10.1111/fem.2008.66.issue-2 |
| Rajaneesh K M, Mitbavkar S, Anil A C, 2017. Influence of short-term hydrographic variations during the north-east monsoon on picophytoplankton community structure in the eastern Arabian Sea. Continental Shelf Research, 146: 28–36 DOI:10.1016/j.csr.2017.08.008 |
| Reynolds C S, 1984. Phytoplankton periodicity:the interactions of form, function and environmental variability. Freshwater Biology, 14(2): 111–142 |
| Riisgård H U, 1988. Efficiency of particle retention and filtration rate in 6 species of Northeast American bivalves. Marine Ecology Progress Series, 45: 217–223 DOI:10.3354/meps045217 |
| Riisgård H U, 2001. On measurement of filtration rate in bivalves-the stony road to reliable data:review and interpretation. Marine Ecology Progress Series, 211(1): 275–291 |
| Safi K A, Hayden B, 2010. Differential grazing on natural planktonic populations by the mussel Perna canaliculus. Aquatic Biology, 11(2): 113–125 DOI:10.3354/ab00297 |
| Souchu P, Vaquer A, Collos Y, et al, 2001. Influence of shellfish farming activities on the biogeochemical composition of the water column in Thau lagoon. Marine Ecology Progress Series, 218(4): 141–152 |
| Tamm M, Laas P, Freiberg R, et al, 2018. Parallel assessment of marine autotrophic picoplankton using flow cytometry and chemotaxonomy. Science of the Total Environment, 625: 185–193 DOI:10.1016/j.scitotenv.2017.12.234 |
| Taniuchi Y, Watanabe T, Kakehi S, et al, 2017. Seasonal dynamics of the phytoplankton community in Sendai Bay, northern Japan. Journal of Oceanography, 73(1): 1–9 DOI:10.1007/s10872-015-0334-0 |
| Wang L, Huang B Q, Liu X, et al, 2015. The modification and optimizing of the CHEMTAX running in the South China Sea. Acta Oceanologica Sinica, 34(2): 124–131 DOI:10.1007/s13131-015-0621-z |
| Wang L H, Ou L J, Huang K X, et al, 2018. Determination of the spatial and temporal variability of phytoplankton community structure in Daya Bay via HPLC-CHEMTAX pigment analysis. Journal of Oceanology & Limnology, 36(3): 750–760 |
| Ward J E, Shumway S E, 2004. Separating the grain from the chaff:particle selection in suspension-and deposit-feeding bivalves. Journal of Experimental Marine Biology & Ecology, 300(1-2): 83–130 |
| Worden A Z, 2006. Picoeukaryote diversity in coastal waters of the Pacific Ocean. Aquatic Microbial Ecology, 43(2): 165–175 |
| Yu Z G, Deng C M, Yao P, et al, 2007. Prasinoxanthin-constaining Prasinophyceae discovered in Jiaozhou Bay, China. Journal of Integrative Plant Biology, 49(4): 497–506 DOI:10.1111/jipb.2007.49.issue-4 |
| Zapata M, Rodríguez F, Garrido J L, 2000. Separation of chlorophylls and carotenoids from marine phytoplankton:a new HPLC method using a reversed phase C8 column and pyridine-containing mobile phases. Marine Ecology Progress Series, 195: 29–45 DOI:10.3354/meps195029 |
| Zhao Y, Zhao L, Xiao T, et al, 2013. Temporal variation of picoplankton in the spring bloom of Yellow Sea, China. Deep-Sea Research Part Ⅱ:Topical Studies in Oceanography, 97: 72–84 DOI:10.1016/j.dsr2.2013.05.015 |
| Zhao Y, Zhao L, Zhang W C, et al, 2016. Variations of picoplankton abundances during blooms in the East China Sea. Deep Sea Research Part Ⅱ:Topical Studies in Oceanography, 124: 100–108 DOI:10.1016/j.dsr2.2015.03.010 |
 2019, Vol. 50


