中国海洋湖沼学会主办。
文章信息
- 马克, 陈朝晖, 李卓然, 宋振杰, 袁志伟, 武斌, 焦强, 王志民. 2021.
- MA Ke, CHEN Zhao-Hui, LI Zhuo-Ran, SONG Zhen-Jie, YUAN Zhi-Wei, WU Bin, JIAO Qiang, WANG Zhi-Min. 2021.
- 马里亚纳海沟万米级水文观测研究
- STUDY ON 10000-M HYDROLOGICAL OBSERVATIONS IN THE MARIANA TRENCH
- 海洋与湖沼, 52(5): 1075-1087
- Oceanologia et Limnologia Sinica, 52(5): 1075-1087.
- http://dx.doi.org/10.11693/hyhz20201100320
文章历史
-
收稿日期:2020-11-26
收修改稿日期:2021-02-01
2. 青岛海洋科学与技术试点国家实验室 海洋动力过程与气候功能实验室 青岛 266237;
3. 中国海洋大学 船舶中心 青岛 266100
2. Laboratory for Ocean Dynamics and Climate, Pilot National Laboratory for Marine Science and Technology(Qingdao), Qingdao 266237, China;
3. Research Vessel Center, Ocean University of China, Qingdao 266100, China
海洋覆盖地球表面积的71%, 而人类对海洋的探索尚不足20%。深度大于6 000 m的深渊海沟不仅是人类认知最少的区域之一(Wolff, 1959—1960), 也是当前海洋学研究的热点和前沿。深渊海水因底层水的通风效应而保持流动(Johnson, 1998), 其理化性质与深层海水相近(Jamieson et al, 2010; Kawagucci et al, 2018), 其变化亦受到潮流和近惯性运动的影响(Taira et al, 2004; Turnewitsch et al, 2014)。海洋有机体在垂向上受到水层的限制(Childress, 1995), 需要克服或者适应静水压力(Somero, 1992), 已有研究表明所有的鱼类都无法在8 400 m以下生存(Jamieson et al, 2012; Yancey et al, 2014)。极端的深渊环境孕育了独特的微生物群落(Todo et al, 2005), 在海沟地形的驱动下, 这些微生物的分布和丰度与深海截然不同(Nunoura et al, 2015)。深渊微生物离不开海表沉降的有机碳(Herndl et al, 2013), 海沟的漏斗效应和构造活动同样会促进有机物在深渊海沟的沉积(Oguri et al, 2013; Ichino et al, 2015)。动植物腐殖质作为有机物的主要来源之一(Luo et al, 2017), 其供应的营养显著地提升了沉积物中的微生物碳转化率(Glud et al, 2013)。由于在深渊领域开展的调查十分有限, 现有数据不足以阐明该区域的物理、化学和生物过程(Liu et al, 2018a)。
尽管人类对深渊的了解仍处于起步阶段, 人为污染对海沟的影响已经逐步显现(Jamieson et al, 2017, 2019), 近期研究发现马里亚纳海沟的持久性有机污染物和微塑料的浓度比开阔大洋高数倍(Dasgupta et al, 2018; Peng et al, 2018)。除此之外, 深海吸收了大量的热能和二氧化碳, 将深渊生态系统置于海洋变暖和酸化之中, 严重地危害了生物多样性和人类福祉(Levin et al, 2015)。近年来, 已有学者开始呼吁深海的治理工作(Mengerink et al, 2014), 这亟需人类对深渊拥有充足的观测和充分的认识。
深海观测战略(deep-ocean observing strategy, DOOS)由全球海洋观测系统(global ocean observing system, GOOS)发起, 旨在协调和拓展深海观测行动, 尤其是对基本海洋变量(essential ocean variable, EOV)的观测(Levin et al, 2019)。针对深海物理科学, DOOS在原有变量的基础上增添了海底压力、海洋湍流和海洋底边界通量, 以填补深海通风、深海变暖、深海混合等领域的观测空白。科学考察船作为最常用的观测平台之一, 能够同时为传感器供应电力、通讯、计时、定位。技术的进步提高了科学考察船的观测能力, 其下放的仪器可以对水体和生物进行采样, 其携带的传感器也相对稳定且精确(Levin et al, 2019)。随着自治技术在海洋观测中的应用和发展(Whitt et al, 2020), 诸如Argo浮标等自治式水下设备(autonomous underwater vehicle, AUV)同样具备了6 000 m以深的观测水平(Roemmich et al, 2019), 但相较传统的观测形式而言, AUV仍面临许多关键性挑战(Bean et al, 2017)。迄今为止, 全海深的探索主要依赖科学考察船。全球海洋船基水文调查项目(global ocean ship-based hydrographic investigations program)就是船基观测的典型实践, 每十年对选定的水文断面执行系统化的重复作业, 以获取物理、化学变量在全海深的水样测量(Talley et al, 2016)。
作为世界上最深的海域(Carruthers et al, 1952; Nakanishi et al, 2011; 刘方兰等, 2013a), 马里亚纳海沟是太平洋板块自东向西俯冲于菲律宾板块之下而形成的一条近南北延伸的深沟(Fujioka et al, 2002; Fryer et al, 2003; 刘鑫等, 2017)。海沟南段呈现出近东西延伸的特征, 能被探测到的最大水深逾10 000 m (刘方兰等, 2013b; Gardner et al, 2014; Stewart et al, 2019), 被称作“挑战者深渊(the challenger deep)”。针对上述科学问题, 国内数个机构曾围绕马里亚纳海沟开展了多学科的观测和实验, 这为进一步探究该区域的生物地球化学现象积累了宝贵的经验和数据(李中石等, 2018; 王泽华等, 2018; 李亚男等, 2020)。本文利用2020年7月“东方红3”船在“挑战者深渊”附近获取的万米级剖面数据, 深入地剖析了当地的水文特征。
1 “挑战者深渊”观测2020年7月初, 副热带高压较往年偏强, 热带西北太平洋受下沉气流控制, 不利于台风的生成和活动(向纯怡等, 2020), 因而适合开展深渊调查。观测地点选定在“挑战者深渊”海域3个小型洼地之一的西部洼地(刘方兰等, 2013a), 该洼地由10 800 m等深线圈闭, 最深处可达10 917 m, 是马里亚纳海沟最深的位置(刘方兰等, 2013b) (图 1)。
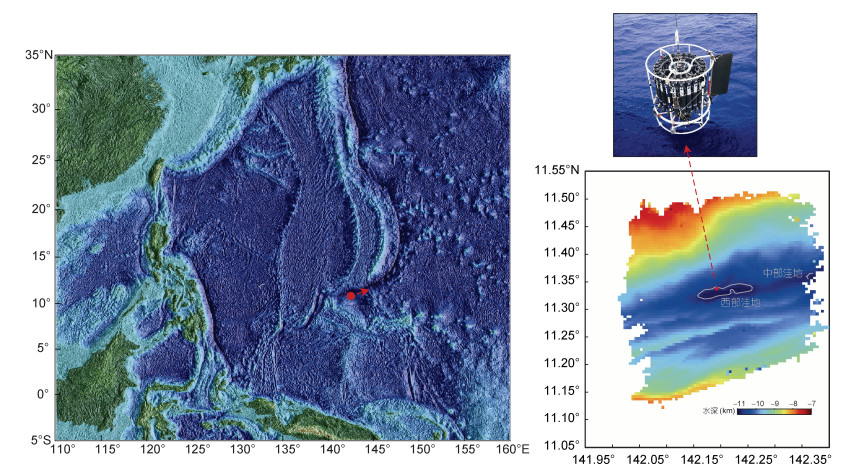 |
| 图 1 热带西太平洋的海底地形(Smith et al, 1997) Fig. 1 The seafloor topography in the tropical western Pacific (Smith et al, 1997) 注: 红点为预计观测站位; Kongsberg Maritime公司的多波束测深系统(EM122)测量的地形经由Caris Hips软件初步处理, 灰线为10 800 m等深线圈闭的西部洼地和中部洼地; 照片为添加导流板后的船载温盐深综合剖面测量系统(由宋振杰提供) |
2020年7月3日, “东方红3”船到达马里亚纳海沟的“挑战者深渊”, 在预计观测站位(142.2°E, 11.33°N)附近开展了为期5 d的多学科海洋调查。观测期间, 船载温盐深综合剖面测量系统(SBE 911/17 Plus)共获取了5个万米级剖面(S1—S5, 表 1)。
| 剖面序号 | CTD编号 | 作业方式 | 入水信息(UTC) | 最大压强(dbar) | ||
| 日期(年.月.日) | 时间(时: 分) | 经纬度 | ||||
| S1 | 1369 | 直读 | 2020.7.3 | 4:23 | 11.332 2°N, 142.202 0°E | 10 814.9 |
| S2 | 1370 | 直读 | 2020.7.3 | 12:12 | 11.331 6°N, 142.201 5°E | 10 817.2 |
| S3 | 1369 | 自容 | 2020.7.4 | 0:24 | 11.331 9°N, 142.202 1°E | 10 270.2 |
| S4 | 1370 | 自容 | 2020.7.4 | 7:59 | 11.332 0°N, 142.202 1°E | 10 333.6 |
| S5 | 1370 | 直读 | 2020.7.6 | 12:44 | 11.331 8°N, 142.202 0°E | 10 291.2 |
| 注: S代表Station, 序号1—5按时间顺序排列; CTD代表温盐深剖面仪 | ||||||
2套Sea-Bird Electronics(SBE)公司的温盐深(conductivity-temperature-depth, CTD)剖面仪(SBE 9Plus)由Markey公司的直拉式绞车(CAST6-125)牵引, 分别以直读和自容的方式实现了对万米水体的精准测量。受传感器的耐压深度所限, CTD仅搭载电导率传感器、温度传感器和压力传感器。三者的采样频率均为24 Hz, 自容作业时存储为4 Hz的平均值。5个剖面中, S1剖面在下放至6 000 m以后频繁出现异常值, S4剖面与其他剖面相比始终存在系统偏差。经初步分析, 前者或由电缆接头透水造成, 尚可依据Pauta准则剔除粗大误差; 后者则因为CTD水泵发生故障, 无法加以有效的修正, 因此本文不予讨论。
2 结果与讨论 2.1 剖面分析分别对S1、S2、S3和S5剖面进行大值剔除、热通量订正、低通滤波、逆压消除等一系列预处理流程(匡晓迪等, 2009), 最终得到质量控制后的电导率、温度和压强资料。剖面仪的CTD位于采水器的尾流区, 且在上升时需要多次悬停并采水, 所以通常选取未受扰动的连续的下行数据。
“东方红3”船装备动力定位系统, 能在作业时动态输出推力和力矩以维持船位和艏向, 从而使4个剖面在水平方向上相距百米之内(表 1)。开阔大洋中, 尤其是在大洋深层, 空间因素导致的温盐差异可以忽略不计。调查期间的海况始终介于1—2级之间, 局地没有极端天气过程产生, 故4个剖面在全水深范围的差异很小, 且随着压强不断增大, 剖面之间的差异越来越小(图 2)。
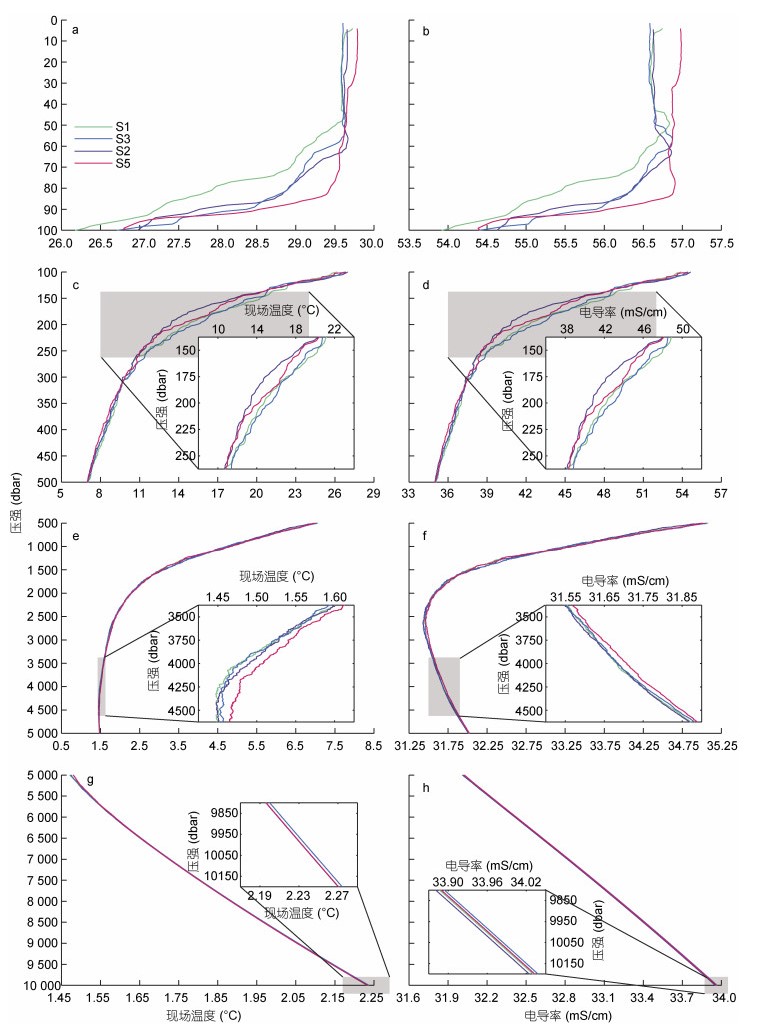 |
| 图 2 现场温度和电导率剖面 Fig. 2 Profiles of in-situ temperature and conductivity 注: 灰色阴影即为被放大的范围; a, c, e, g表示1369号温盐深剖面仪; b, d, f, h表示1370号温盐深剖面仪 |
如图 2a所示, 表层(5 dbar)海水的现场温度为29.605—29.787 ℃, 该范围在混合层内保持相对稳定。S1、S2和S3剖面的观测时段相邻, 混合层深度遵循当地(UTC+10)的昼夜变化, 现场温度在混合层中的变化趋势基本一致(图 2a)。尽管S5与S2剖面在2 d中的观测时间接近(表 1), 但前者入水时的风速高达11.0 m/s, 混合层因受到风应力搅拌而加深, 其温盐结构与后者迥异(图 2a, 2b)。如图 2c所示, 海水的现场温度在温跃层(depth of the 20 ℃ isotherm; Rebert et al, 1985)内迅速降低, 由于受到温跃层中多种动力过程的共同调制, 剖面之间的温差可达2.493 ℃。在温跃层以下, 海水的现场温度逐渐降至1.447—1.465 ℃, 对应的压强约为4 324—4 597 dbar(图 2e)。在此范围内, 海洋的长周期变化占据主导作用, 所以S1、S2和S3剖面的现场温度和电导率比较接近(图 2e, 2f)。当压强继续增大时, 现场温度因为绝热压缩而缓慢升高(Taira et al, 2005), 底层(10 250 dbar)海水的现场温度可升至2.280—2.284 ℃(图 2g)。S2和S5剖面由同一套仪器测量, 现场温度的差异逐渐接近0.001 ℃(图 2g), 逼近传感器精度的上限, 足见“挑战者深渊”深层海水的稳定性。相比之下, 虽然S1和S3剖面也出自同一套仪器, 但二者的现场温度在底层表现出0.004 ℃的差异(图 2g)。对比各自的上下行剖面, 可知S1剖面在深层的差异约为0.000 2 ℃, 几乎达到温度传感器的分辨率, 而S3剖面的差异在上行过程中逐渐扩大(图略)。这暴露了自容作业的不足: 镍-氢电池的电压在低温环境下迅速降低, 导致S3剖面后半程的现场温度整体偏高, 大约等效于20 dbar的温度差异。
温度对电导率的影响远大于盐度, 因此电导率的变化趋势与现场温度类似。不同的是, S1、S3和S5剖面的电导率更为接近(图 2h)。随着现场温度在深层变得稳定, 盐度对电导率的贡献逐渐增大。由于盐度扩散系数小于温度扩散系数, 距离越近的剖面(表 1), 其电导率越一致。在海洋深层, S5剖面的电导率明显偏离另外2个剖面(图 2h), 可能是仪器不同的原因——由不同的标准海水所校正的电导率传感器之间也会存在一定的偏差(Uchida et al, 2020)。此外, S1和S3剖面在底层的电导率差异略大于传感器精度, 该差异可能来自深层的潮汐和惯性运动(Taira et al, 2004)。
为了方便与前人的研究进行比较, 本节仍使用实用盐度和位势温度, 后续章节则采用保守温度和绝对盐度的定义。在混合层以下, 实用盐度的最大值和最小值分别为34.806—34.866和34.296—34.314, 各自出现在119—148 dbar和242—273 dbar的位置(图 3a), 依次对应北太平洋热带水(north Pacific tropical water, NPTW)和北太平洋中层水(north Pacific intermediate water, NPIW)的水团性质(Talley, 1993; Wang et al, 2013)。4个剖面均在3 000— 5 000 dbar的压强范围里表现出1—1.5 ℃以及34.66—34.70的特征(图 3b), 该特征与下层绕极水(lower circumpolar water, LCPW)的水团性质相符(Johnson et al, 1993; Siedler et al, 2004)。在北半球的夏季, 深层西边界流沿关岛东侧的陆坡向南流动, 其西向分支将LCPW输送至“挑战者深渊”附近(Huang et al, 2018)。通过上升流和混合的作用, LCPW转换为北太平洋底层水(north Pacific deep water, NPDW), 其特征与上层绕极水(upper circumpolar water, UCPW)的水团性质几乎相同, 二者在局地难以区分(Kawabe et al, 2010; Wang et al, 2020)。7 000—10 000 dbar的范围内, 海水的实用盐度总共增加0.003 4—0.004 5, 位势温度也升高0.001 ℃左右(图 3c)。前人在分析深层水样时发现海水的实用盐度几乎不变(Mantyla et al, 1978) (图 3c), 因此有必要对电导率数据做进一步的修正(van Haren et al, 2021)。修正后的盐度值仅略有增大(图 5d), 以补偿位势温度在深层的升高, 从而维持海水的中性层结(图 6c)。虽然无法评估颠倒温度计的误差大小, 但位势温度升高0.01 ℃所造成的4 000 dbar不稳定水层显然不可能存在(Taira et al, 2005)。位势温度在7 000 dbar以下缓慢升高, 相应的保守温度则缓慢降低(图略), 这足以说明后者在海洋深层表现得更加保守。保守温度是对单位质量海水的热含量的精确度量(McDougall, 2003), 其保守性是位势温度的100余倍(IOC et al, 2010)。深层海水的温盐变化共同引起位势密度的增大(图 5a), 这极有可能与变性的南极底层水(Antarctic bottom water, AABW)的输入有关(van Haren et al, 2021)。
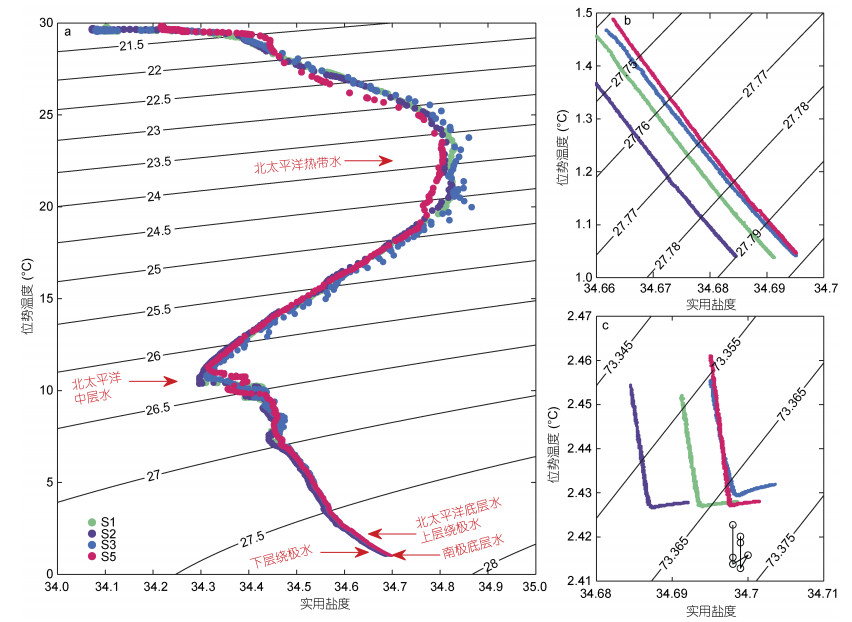 |
| 图 3 位势温度和实用盐度的温盐图 Fig. 3 T-S Diagrams of potential temperature and practical salinity 注: 黑色等值线为位势密度的超量; a为全剖面范围的点聚图, 位势密度的参考压强为0 dbar, 箭头为水团的位置; b为3 000—5 000 dbar范围的点聚图, 参考压强为0 dbar; c为5 000—10 250 dbar范围的点聚图, 参考压强为11 000 dbar, 黑色圆圈为前人在INDOPAC 3-21处(142°10.3′E, 11°20′N)获取的水文资料(Mantyla et al, 1978) |
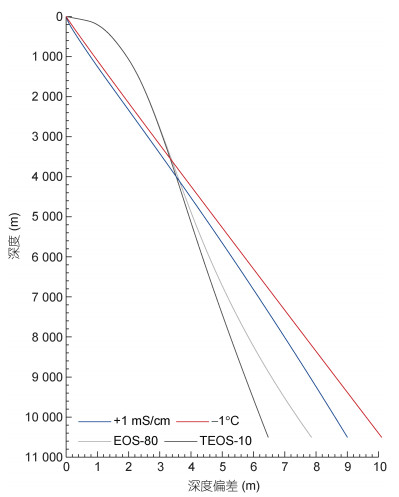 |
| 图 4 S2剖面在不同条件下的深度偏差 Fig. 4 Depth deviations based on profile S2 under different circumstances 注: 灰线为采用国际海水状态方程(international equation of state of seawater, EOS-80)导致的偏差, 黑线为采用国际海水热力学方程(international thermodynamic equation of seawater, TEOS-10)导致的偏差, 蓝线为电导率增大1 mS/cm造成的偏差, 红线为现场温度减少1 ℃造成的偏差 |
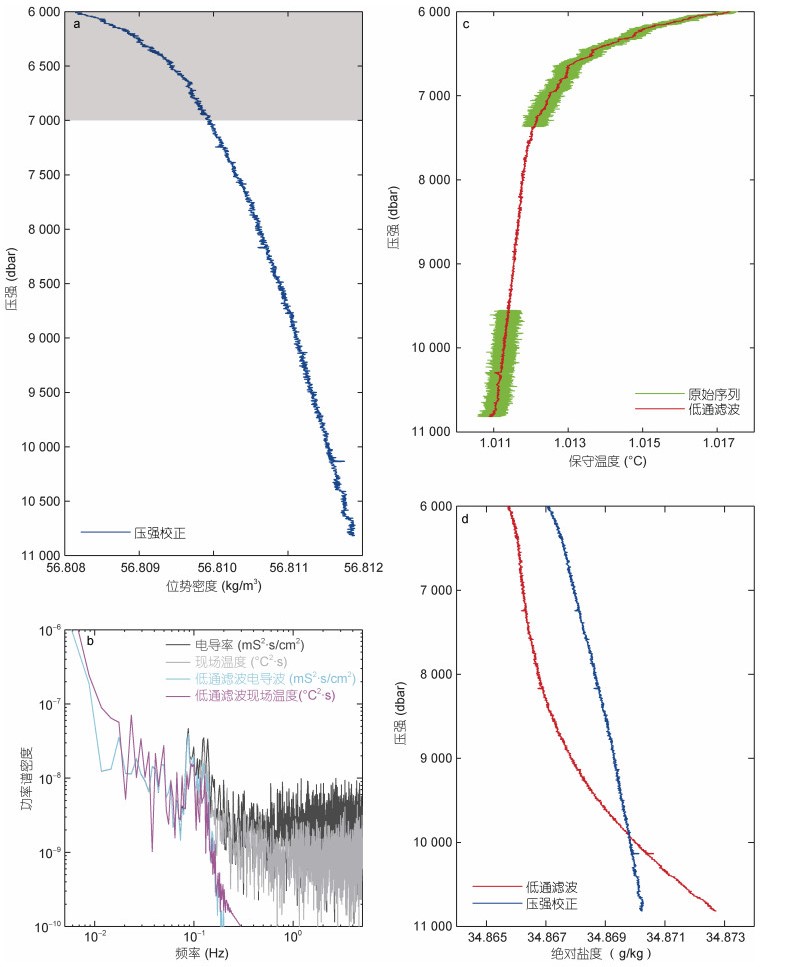 |
| 图 5 S2剖面的位势密度(a)、功率谱密度(b)、保守温度(c)和绝对盐度(d) Fig. 5 The potential density (a), power spectral density (b), conservative temperature (c), and absolute salinity (d) derived from profile S2 注: a中灰色阴影为功率谱密度的计算范围(6 000—7 000 dbar), 原始序列的功率谱密度在0.1 Hz左右具有峰值, 因此利用Kaiser窗设计截断频率为0.05 Hz的低通滤波器来移除表面波浪的影响(van Haren, 2015) |
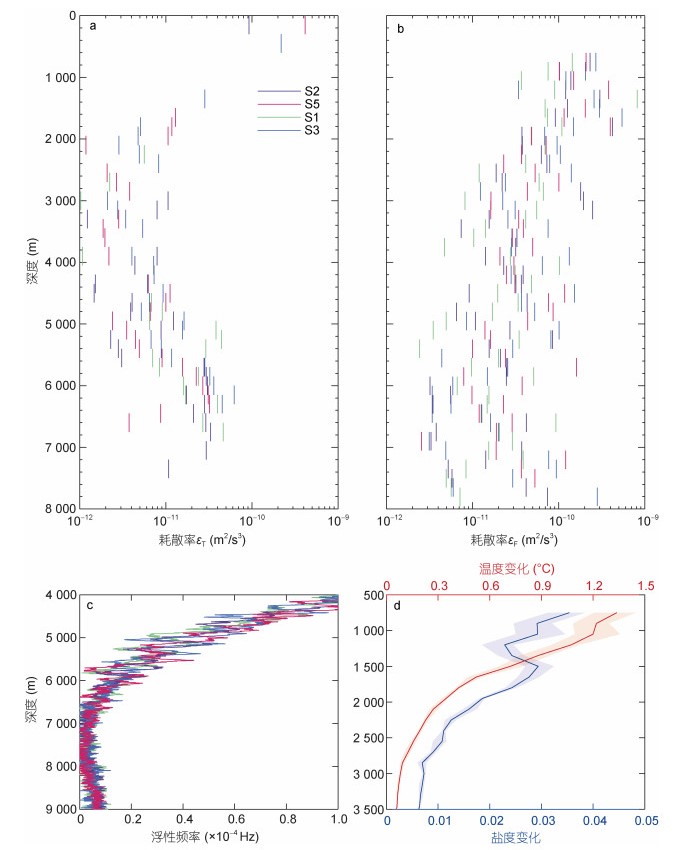 |
| 图 6 剖面的湍动能耗散率片段 Fig. 6 Segments of turbulent kinetic energy dissipation rates estimated from profiles 注: a为Thorpe尺度方法估算的耗散率εT; b为细尺度参数化方法估算的耗散率εF; 粗线为满足温盐变化阈值的片段, 细线为不满足温盐变化阈值的片段; c为100 dbar平滑的浮性频率; d为片段的温盐变化, 阴影为变化范围; a, c表示1369号温盐深剖面仪; b, d表示1370号温盐深剖面仪 |
在深海大洋中, 明确仪器所处的深度是保证观测安全和数据准确的重要前提。CTD仅能提供压强信息, 应后续章节的计算需求, 本节将压强换算为深度。Saunders等(1976)根据静压平衡方程和Knudsen-Ekman状态方程提出了一个压强和深度的转换公式。考虑到简易性和一致性, Fofonoff等(1983)基于“国际海水状态方程(international equation of state of seawater, EOS-80; UNESCO, 1981)”发展了一个新的公式。Feistel等(2008)从Gibbs方程出发, 通过数学方法推导海水性质, 保证了热力学性质的自洽性和完备性。这种新的方法被用于“国际海水热力学方程(international thermodynamic equation of seawater, TEOS-10; IOC et al, 2010)”。根据比容的75项表达式(Roquet et al, 2015), 可以进一步得到压强和深度的关系方程。在两种方法的实践中, 往往不考虑密度的垂向变化。为了计算精确的深度, 直接对静压平衡方程进行垂向积分。
 (1)
(1)其中, g(z)是随深度z变化的重力加速度; v(p)是随压强p变化的比容。以此为基准深度, 减去相同压强下的其他深度作为深度偏差。如图 4所示, 在10 000 m的深度范围内, 忽略密度分布将会导致6—8 m的偏差。在压强转换深度时, EOS-80采用了多次近似, 所以其偏差稍大于TEOS-10的结果(图 4)。
传感器误差对深度计算的影响很小, 整体上可以忽略不计。以误差较大的电导率传感器为例, 1 mS/cm的电导率误差对应约10−2的盐度误差。根据线性海水状态方程, 盐度通过盐收缩系数改变密度, 因此密度误差约为10−6 kg/m3。依据静压平衡方程, 1 dbar水柱的高度误差约为10−3 m, 10 000 dbar水柱累积的误差应为10 m左右。温度传感器同理, 1 ℃的温度误差仅造成10 m左右的误差(图 4)。正常情况下, 传感器误差的量级远小于1, 且误差的大小在剖面上并非一成不变。以误差最大的S4剖面为例, 由于水泵故障, 电导率和现场温度的误差约为0.02 mS/cm和0.01 ℃, 同时考虑压力传感器的精度和漂移, 深度偏差在整个剖面上的积分仍小于2 m(图略)。
2.3 湍动能耗散率估算海洋中的湍流混合影响热量输运、水团变化、深海层结(Munk et al, 1998), 进而调制海洋环流、引发气候变化(Wunsch et al, 2004)。深海大洋的混合较弱, 传统的湍流观测手段难以奏效(Yasuda et al, 2021), 本节仅以温盐参数化的方式评估湍动能耗散率的大小和变化。
水体翻转是混合的具体表现形式, 通过量化翻转尺度, 可以估算出水体翻转的耗散率(Thorpe, 1977)。
 (2)
(2)其中, εT是耗散率; a = 0.8是比例常数(Dillon, 1982); LT是Thorpe尺度(Thorpe, 1977); N是浮性频率。对于符合定义的水体翻转(Dillon, 1984), 需要利用观测的分辨率和仪器的噪声水平加以筛选(Galbraith et al, 1996)。排除虚假的水体翻转以后(Thompson et al, 2007), 再对耗散率进行片段平均(Finnigan et al, 2002)。
此外, 内波破碎也会触发湍流混合, 使能量向小尺度传递(Gregg et al, 2003)。基于波-波相互作用理论(Gregg, 1989), 引入拉伸坐标(Polzin et al, 1995), 得到含有剪切/拉伸方差比的细尺度参数化公式(Kunze et al, 2006)。
 (3)
(3)其中, K是扩散率; K0=0.05×10⁻⁴ m2/s; 〈ξz2〉2是拉伸方差; GM〈ξz2〉2是Garrett-Munk模型谱的拉伸方差(Gregg et al, 1991); h2(Rω)是与剪切/拉伸方差比Rω=7有关的参数(Kunze et al, 2006); j(f/N)是与科氏参数f和浮性频率N有关的参数(Gregg et al, 2003)。采用Osborn(1980)提出的模型, 可以进一步估算出耗散率。
 (4)
(4)其中, εF是耗散率; K是扩散率; N是浮性频率; Γ=0.2是混合效率(Oakey, 1982)。
为了尽可能地控制误差范围, 需要对仪器和数据进行人为调整。例如, 在采水架的侧面添加导流板(Uchida et al, 2018) (图 1), 减少剖面仪旋转引起的温度波动(Uchida et al, 2015); 将原始数据低通滤波(van Haren, 2015) (图 5b, c), 削弱涌浪造成的船体运动(Taira et al, 2005); 对电导率进行压强修正(van Haren et al, 2021), 消除深层盐度值的虚假增量(van Haren et al, 2017) (图 5d)。另外, 考虑到两种方法的合理性, 本文将水体翻转的最大尺度限制为100 m(van Haren et al, 2017) (图略), 并将片段的温盐变化阈值设定为0.1 ℃和0.01(Whalen et al, 2015) (图 6d)。相比细尺度参数化方法所普遍采用的分辨率(2 m), Thorpe尺度方法对采样频率的要求更高(2 Hz, 约0.5 m), 其结果在很大程度上取决于数据的质量, 因此有必要采取额外的措施以提高数据的可靠性。例如, 改变水泵进出水口的朝向(van Haren et al, 2016), 用采集的水样校正不同层次的盐度(Mantyla et al, 1978), 甚至对原始序列进行人工甄别。
在2 000 m以浅, 单个翻转的εT为10−8—10−7 m2/s3。由于范围内的翻转个数较少, 片段平均后的εT为10−10—10−9 m2/s3(图 6a), 与同一深度下的εF相当(图 6b)。鉴于湍流具有随机性, Thorpe尺度方法仅在统计层面有效(Thorpe, 1977), 所以根据少数翻转估算出的εT未必准确, 需要通过现场观测的耗散率进行验证。
在2 000—3 000 m的深度内, 海水的现场温度和电导率平稳递减(图 2e, f)。水体翻转的Thorpe尺度相对较小, 所以εT相应减小(图 6a), 同样的现象也出现在邻近的雅浦海沟内(Liu et al, 2018b)。同一深度下的εF也明显减小(图 6b), 这说明内波的活跃程度较低, 层结较强的海水处于稳定状态, 不易发生水体翻转(Alford et al, 2000)。εT比εF小1个量级, 不足以反映此处的耗散率特征。多数关于马里亚纳海沟的研究并未提及3 000 m以浅的耗散率变化(van Haren et al, 2017; Huang et al, 2018; van Haren et al, 2021), 因此无法进一步佐证本文的结果。
εF在5 000 m以深显著增强(Huang et al, 2018) (图 6a), 量级上接近同一深度下的εF(图 6b), 可能是由周围海山产生的内潮所致, 而吕宋海峡产生的内潮受马里亚纳海脊阻隔(Morozov, 1995), 难以传播至此地。6 000—8 000 m的层结最弱, 约为底层的一半(图 6c), 有利于内潮的自由传播(van Haren et al, 2017), 故耗散率略有增大。底层的内潮可能来自马里亚纳岛弧(Jayne et al, 2001), 局地的非线性作用产生较强的剪切, 促进了较弱层结背景下的混合。此外, 内波破碎也会诱发数百米高的对流, 伴随着水体入侵, 耗散率得到提升(van Haren, 2020)。虽然底层的εF可达10−10 m2/s3, 但此处的温盐变化极小(图 6d), 细尺度参数化方法已经不再适用(Hibiya et al, 2012)。在8 000 m以深, 没有检测到有效的水体翻转, 这与前人的研究有所出入(van Haren et al, 2017, 2021), 因为Thorpe尺度方法具有一定的主观性(Smith, 2020)。例如, Huang等(2018)在相近位置估算出的耗散率比本文大2个量级, 远远偏离现场观测的耗散率(Goto et al, 2021)。
利用剖面仪估算的耗散率跨越3个量级, 其范围与开阔大洋大致相当(Gregg, 1989)。仪器噪声是造成耗散率误差的主要原因: 在Thorpe尺度方法中, 噪声掩盖了位势密度的真实变化, 多个相邻的翻转形成一个较大的翻转, 其尺度远大于限定值, 因而被视为虚假的翻转, 最终导致片段平均的εT变小; 在细尺度参数化方法中, 噪声使观测的拉伸谱蓝移, 当拉伸方差达到上限时, 积分的波数范围变窄, 因此Garrett-Munk模型谱的拉伸方差相对变小, 最终导致εF变大。在层结较弱的情况下, εF会被严重高估(Kunze et al, 2006)。此外, 潮致混合也会高估εF(Jing et al, 2011), 由于5 000 m以深的混合主要源自内潮, 所以海洋深层的εF总体偏大。
通过比较两种参数化方法的结果, 可以初步验证耗散率的准确性。但需要注意的是, 参数化公式本身存在很大的不确定性。例如, 比例常数依赖于湍流发展的阶段(Mater et al, 2015; Scotti, 2015), 混合效率取决于湍流发生的原因(Gregg et al, 2018); 深层的比例常数和混合效率约为0.1和1, 而上层则恰恰相反(Ijichi et al, 2018)。
3 结论2020年7月, “东方红3”船在马里亚纳海沟的“挑战者深渊”附近完成了为期5 d的海上调查, 共获取了5个万米级剖面, 其中的4个剖面可以用于本文的研究。本文分析了万米水深的温盐性质, 基于EOS-80和TEOS-10评估了深度偏差, 依据Thorpe尺度方法和细尺度参数化方法估算了湍动能耗散率, 初步得出以下结论:
(1) 在4 500 dbar左右, 海水的现场温度降至最低。深层海水的现场温度因绝热压缩而升高, 底层海水的现场温度与2 000 dbar左右一致。相比电导率, 现场温度在深层更加保守, 时空分布更为均一。海水在3 000—5 000 dbar的温盐特征与LCPW相同, 7 000 dbar以下的水体性质与AABW的输入有关。7 000—10 000 dbar的范围内, 位势温度缓慢升高, 保守温度缓慢降低, 盐度缓慢升高以维持中性层结。
(2) 对于10 000 m的海水而言, 忽略密度的垂向变化会造成6—8 m的深度偏差, 而传感器精度仅影响2 m以内的深度偏差。
(3) 2 000—3 000 m的耗散率明显减小, 5 000— 8 000 m的耗散率明显增大。前者是因为背景层结较强, 后者则是由于内潮活跃。8 000 m以深的耗散率有所提升, 但此处的温盐变化较小, 参数化方法存在较大误差。
致谢 感谢中国海洋大学船舶中心的赵忠生和杨荣民为此次调查提供的条件保障, 感谢“东方红3”船的全体人员为调查工作付出的辛苦努力。
王泽华, 邹立, 陈洪涛, 等. 2018. 马里亚纳海沟水体溶解有机物的垂直分布特征. 中国海洋大学学报, 48(2): 85-90 |
匡晓迪, 郭心顺, 范洪涛. 2009. CTD资料预处理规范化的探讨. 海洋技术, 28(2): 33-36 DOI:10.3969/j.issn.1003-2029.2009.02.009 |
向纯怡, 黄彬, 柳龙生. 2020. 2020年夏季海洋天气评述. 海洋气象学报, 40(4): 11-21 |
刘鑫, 李三忠, 赵淑娟, 等. 2017. 马里亚纳俯冲系统的构造特征. 地学前缘, 24(4): 329-340 |
刘方兰, 曲佳. 2013a. 马里亚纳海沟水深探测及"挑战者深渊"海底地形特征. 海洋地质前沿, 29(4): 7-11 |
刘方兰, 杨胜雄, 邓希光, 等. 2013b. 马里亚纳海沟"挑战者深渊"最深点水深探测. 海洋测绘, 33(5): 49-52 |
李中石, 汪岷, 罗志祥, 等. 2018. 马里亚纳海沟浮游病毒垂直分布及动态变化. 海洋与湖沼, 49(6): 1251-1258 |
李亚男, 陈洪涛, 谷文艳, 等. 2020. 马里亚纳海沟"挑战者深渊"营养盐的垂直分布特征. 中国海洋大学学报, 50(1): 74-81 |
Alford M H, Pinkel R, 2000. Observations of overturning in the thermocline: the context of ocean mixing. Journal of Physical Oceanography, 30(5): 805-832 DOI:10.1175/1520-0485(2000)030<0805:OOOITT>2.0.CO;2 |
Bean T P, Greenwood N, Beckett R et al, 2017. A review of the tools used for marine monitoring in the UK: combining historic and contemporary methods with modeling and socioeconomics to fulfill legislative needs and scientific ambitions. Frontiers in Marine Science, 4: 263 DOI:10.3389/fmars.2017.00263 |
Carruthers J N, Lawford A L, 1952. The deepest oceanic sounding. Nature, 169(4302): 601-603 DOI:10.1038/169601a0 |
Childress J J, 1995. Are there physiological and biochemical adaptations of metabolism in deep-sea animals?. Trends in Ecology & Evolution, 10(1): 30-36 |
Dasgupta S, Peng X, Chen S et al, 2018. Toxic anthropogenic pollutants reach the deepest ocean on Earth. Geochemical Perspectives Letters, 7: 22-26 |
Dillon T M, 1982. Vertical overturns: a comparison of Thorpe and Ozmidov length scales. Journal of Geophysical Research: Oceans, 87(C12): 9601-9613 DOI:10.1029/JC087iC12p09601 |
Dillon T M, 1984. The energetics of overturning structures: implications for the theory of fossil turbulence. Journal of Physical Oceanography, 14(3): 541-549 DOI:10.1175/1520-0485(1984)014<0541:TEOOSI>2.0.CO;2 |
Feistel R, Wright D G, Miyagawa K et al, 2008. Mutually consistent thermodynamic potentials for fluid water, ice and seawater: a new standard for oceanography. Ocean Science, 4(4): 275-291 DOI:10.5194/os-4-275-2008 |
Finnigan T D, Luther D S, Lukas R, 2002. Observations of enhanced diapycnal mixing near the Hawaiian ridge. Journal of Physical Oceanography, 32(11): 2988-3002 DOI:10.1175/1520-0485(2002)032<2988:OOEDMN>2.0.CO;2 |
Fofonoff C N, Millard Jr R C, 1983. Algorithms for computation of fundamental properties of seawater. UNESCO Technical Papers in Marine Science No. 44, Paris, France: Unesco, 53
|
Fryer P, Becker N, Appelgate B et al, 2003. Why is the Challenger Deep so deep?. Earth and Planetary Science Letters, 211(3-4): 259-269 DOI:10.1016/S0012-821X(03)00202-4 |
Fujioka K, Okino K, Kanamatsu T et al, 2002. Morphology and origin of the challenger deep in the southern Mariana Trench. Geophysical Research Letters, 29(10): 10-1 |
Galbraith P S, Kelley D E, 1996. Identifying overturns in CTD profiles. Journal of Atmospheric and Oceanic Technology, 13(3): 688-702 DOI:10.1175/1520-0426(1996)013<0688:IOICP>2.0.CO;2 |
Gardner J V, Armstrong A A, Calder B R et al, 2014. So, how deep is the Mariana Trench?. Marine Geodesy, 37(1): 1-13 DOI:10.1080/01490419.2013.837849 |
Glud R N, Wenzhöfer F, Middelboe M et al, 2013. High rates of microbial carbon turnover in sediments in the deepest oceanic trench on Earth. Nature Geoscience, 6(4): 284-288 DOI:10.1038/ngeo1773 |
Goto Y, Yasuda I, Nagasawa M et al, 2021. Estimation of Basin-scale turbulence distribution in the North Pacific Ocean using CTD-attached thermistor measurements. Scientific Reports, 11(1): 969 DOI:10.1038/s41598-020-80029-2 |
Gregg M C, 1989. Scaling turbulent dissipation in the thermocline. Journal of Geophysical Research: Oceans, 94(C7): 9686-9698 DOI:10.1029/JC094iC07p09686 |
Gregg M C, D'Asaro E A, Riley J J et al, 2018. Mixing efficiency in the ocean. Annual Review of Marine Science, 10(1): 443-473 DOI:10.1146/annurev-marine-121916-063643 |
Gregg M C, Kunze E, 1991. Shear and strain in Santa Monica Basin. Journal of Geophysical Research: Oceans, 96(C9): 16709-16719 DOI:10.1029/91JC01385 |
Gregg M C, Sanford T B, Winkel D P, 2003. Reduced mixing from the breaking of internal waves in equatorial waters. Nature, 422(6931): 513-515 DOI:10.1038/nature01507 |
Herndl G J, Reinthaler T, 2013. Microbial control of the dark end of the biological pump. Nature Geoscience, 6(9): 718-724 DOI:10.1038/ngeo1921 |
Hibiya T, Furuichi N, Robertson R, 2012. Assessment of fine-scale parameterizations of turbulent dissipation rates near mixing hotspots in the deep ocean. Geophysical Research Letters, 39(24): L24601 |
Huang C J, Xie Q, Wang D X et al, 2018. Seasonal variability of water characteristics in the Challenger Deep observed by four cruises. Scientific Reports, 8(1): 11791 DOI:10.1038/s41598-018-30176-4 |
Ichino M C, Clark M R, Drazen J C et al, 2015. The distribution of benthic biomass in hadal trenches: a modelling approach to investigate the effect of vertical and lateral organic matter transport to the seafloor. Deep Sea Research Part Ⅰ: Oceanographic Research Papers, 100: 21-33 DOI:10.1016/j.dsr.2015.01.010 |
Ijichi T, Hibiya T, 2018. Observed variations in turbulent mixing efficiency in the deep ocean. Journal of Physical Oceanography, 48(8): 1815-1830 DOI:10.1175/JPO-D-17-0275.1 |
IOC, SCOR, IAPSO, 2010. The international thermodynamic equation of seawater-2010: calculation and use of thermodynamic properties. Intergovernmental Oceanographic Commission, Manuals and Guides No. 56, Paris, France: UNESCO, 196
|
Jamieson A J, Brooks L S R, Reid W D K et al, 2019. Microplastics and synthetic particles ingested by deep-sea amphipods in six of the deepest marine ecosystems on Earth. Royal Society Open Science, 6(2): 180667 DOI:10.1098/rsos.180667 |
Jamieson A J, Fujii T, Mayor D J et al, 2010. Hadal trenches: the ecology of the deepest places on Earth. Trends in Ecology & Evolution, 25(3): 190-197 |
Jamieson A J, Malkocs T, Piertney S B et al, 2017. Bioaccumulation of persistent organic pollutants in the deepest ocean fauna. Nature Ecology & Evolution, 1(3): 0051 |
Jamieson A J, Yancey P H, 2012. On the validity of the Trieste flatfish: dispelling the myth. The Biological Bulletin, 222(3): 171-175 DOI:10.1086/BBLv222n3p171 |
Jayne S R, Laurent L C S, 2001. Parameterizing tidal dissipation over rough topography. Geophysical Research Letters, 28(5): 811-814 DOI:10.1029/2000GL012044 |
Jing Z, Wu L X, Li L et al, 2011. Turbulent diapycnal mixing in the subtropical northwestern Pacific: spatial-seasonal variations and role of eddies. Journal of Geophysical Research: Oceans, 116(C10): C10028 DOI:10.1029/2011JC007142 |
Johnson G C, 1998. Deep water properties, velocities, and dynamics over ocean trenches. Journal of Marine Research, 56(2): 329-347 DOI:10.1357/002224098321822339 |
Johnson G C, Toole J M, 1993. Flow of deep and bottom waters in the Pacific at 10°N. Deep Sea Research Part Ⅰ: Oceanographic Research Papers, 40(2): 371-394 DOI:10.1016/0967-0637(93)90009-R |
Kawabe M, Fujio S, 2010. Pacific Ocean circulation based on observation. Journal of Oceanography, 66(3): 389-403 DOI:10.1007/s10872-010-0034-8 |
Kawagucci S, Makabe A, Kodama T et al, 2018. Hadal water biogeochemistry over the Izu-Ogasawara Trench observed with a full-depth CTD-CMS. Ocean Science, 14(4): 575-588 DOI:10.5194/os-14-575-2018 |
Kunze E, Firing E, Hummon J M et al, 2006. Global abyssal mixing inferred from lowered ADCP shear and CTD strain profiles. Journal of Physical Oceanography, 36(8): 1553-1576 DOI:10.1175/JPO2926.1 |
Levin L A, Bett B J, Gates A R et al, 2019. Global observing needs in the deep ocean. Frontiers in Marine Science, 6: 241 DOI:10.3389/fmars.2019.00241 |
Levin L A, Le Bris N, 2015. The deep ocean under climate change. Science, 350(6262): 766-768 DOI:10.1126/science.aad0126 |
Liu R L, Wang L, Wei Y L et al, 2018a. The hadal biosphere: recent insights and new directions. Deep Sea Research Part Ⅱ: Topical Studies in Oceanography, 155: 11-18 DOI:10.1016/j.dsr2.2017.04.015 |
Liu Y Z, Liu X H, Lv X Q et al, 2018b. Watermass properties and deep currents in the northern Yap Trench observed by the Submersible Jiaolong system. Deep Sea Research Part Ⅰ: Oceanographic Research Papers, 139: 27-42 DOI:10.1016/j.dsr.2018.06.001 |
Luo M, Gieskes J, Chen L Y et al, 2017. Provenances, distribution, and accumulation of organic matter in the southern Mariana Trench rim and slope: implication for carbon cycle and burial in hadal trenches. Marine Geology, 386: 98-106 DOI:10.1016/j.margeo.2017.02.012 |
Mantyla A W, Reid J L, 1978. Measurements of water characteristics at depths greater than 10 km in the Marianas Trench. Deep Sea Research, 25(2): 169-173 DOI:10.1016/0146-6291(78)90004-8 |
Mater B D, Venayagamoorthy S K, Laurent L S et al, 2015. Biases in Thorpe-scale estimates of turbulence dissipation. Part Ⅰ: assessments from large-scale overturns in oceanographic data. Journal of Physical Oceanography, 45(10): 2497-2521 DOI:10.1175/JPO-D-14-0128.1 |
McDougall T J, 2003. Potential enthalpy: a conservative oceanic variable for evaluating heat content and heat fluxes. Journal of Physical Oceanography, 33(5): 945-963 DOI:10.1175/1520-0485(2003)033<0945:PEACOV>2.0.CO;2 |
Mengerink K J, Van Dover C L, Ardron J et al, 2014. A call for deep-ocean stewardship. Science, 344(6185): 696-698 DOI:10.1126/science.1251458 |
Morozov E G, 1995. Semidiurnal internal wave global field. Deep Sea Research Part Ⅰ: Oceanographic Research Papers, 42(1): 135-148 DOI:10.1016/0967-0637(95)92886-C |
Munk W, Wunsch C, 1998. Abyssal recipes Ⅱ: energetics of tidal and wind mixing. Deep Sea Research Part Ⅰ: Oceanographic Research Papers, 45(12): 1977-2010 DOI:10.1016/S0967-0637(98)00070-3 |
Nakanishi M, Hashimoto J, 2011. A precise bathymetric map of the world's deepest seafloor, Challenger Deep in the Mariana Trench. Marine Geophysical Research, 32(4): 455-463 DOI:10.1007/s11001-011-9134-0 |
Nunoura T, Takaki Y, Hirai M et al, 2015. Hadal biosphere: insight into the microbial ecosystem in the deepest ocean on Earth. Proceedings of the National Academy of Sciences of the United States of America, 112(11): E1230-E1236 DOI:10.1073/pnas.1421816112 |
Oakey N S, 1982. Determination of the rate of dissipation of turbulent energy from simultaneous temperature and velocity shear microstructure measurements. Journal of Physical Oceanography, 12(3): 256-271 DOI:10.1175/1520-0485(1982)012<0256:DOTROD>2.0.CO;2 |
Oguri K, Kawamura K, Sakaguchi A et al, 2013. Hadal disturbance in the Japan Trench induced by the 2011 Tohoku-Oki Earthquake. Scientific Reports, 3: 1915 DOI:10.1038/srep01915 |
Osborn T R, 1980. Estimates of the local rate of vertical diffusion from dissipation measurements. Journal of Physical Oceanography, 10(1): 83-89 DOI:10.1175/1520-0485(1980)010<0083:EOTLRO>2.0.CO;2 |
Peng X, Chen M, Chen S et al, 2018. Microplastics contaminate the deepest part of the world's ocean. Geochemical Perspectives Letters, 9: 1-5 |
Polzin K L, Toole J M, Schmitt R W, 1995. Finescale parameterizations of turbulent dissipation. Journal of Physical Oceanography, 25(3): 306-328 DOI:10.1175/1520-0485(1995)025<0306:FPOTD>2.0.CO;2 |
Rebert J P, Donguy J R, Eldin G et al, 1985. Relations between sea level, thermocline depth, heat content, and dynamic height in the tropical Pacific Ocean. Journal of Geophysical Research: Oceans, 90(C6): 11719-11725 DOI:10.1029/JC090iC06p11719 |
Roemmich D, Alford M H, Claustre H et al, 2019. On the future of Argo: a global, full-depth, multi-disciplinary array. Frontiers in Marine Science, 6: 439 DOI:10.3389/fmars.2019.00439 |
Roquet F, Madec G, McDougall T J et al, 2015. Accurate polynomial expressions for the density and specific volume of seawater using the TEOS-10 standard. Ocean Modelling, 90: 29-43 DOI:10.1016/j.ocemod.2015.04.002 |
Saunders P M, Fofonoff N P, 1976. Conversion of pressure to depth in the ocean. Deep Sea Research and Oceanographic Abstracts, 23(1): 109-111 DOI:10.1016/0011-7471(76)90813-5 |
Scotti A, 2015. Biases in Thorpe-scale estimates of turbulence dissipation. Part Ⅱ: energetics arguments and turbulence simulations. Journal of Physical Oceanography, 45(10): 2522-2543 |
Siedler G, Holfort J, Zenk W et al, 2004. Deep-water flow in the Mariana and Caroline Basins. Journal of Physical Oceanography, 34(3): 566-581 DOI:10.1175/2511.1 |
Smith J A, 2020. A comparison of two methods using Thorpe sorting to estimate mixing. Journal of Atmospheric and Oceanic Technology, 37(1): 3-15 DOI:10.1175/JTECH-D-18-0234.1 |
Smith W H F, Sandwell D T, 1997. Global sea floor topography from satellite altimetry and ship depth soundings. Science, 277(5334): 1956-1962 DOI:10.1126/science.277.5334.1956 |
Somero G N, 1992. Adaptations to high hydrostatic pressure. Annual Review of Physiology, 54: 557-577 DOI:10.1146/annurev.ph.54.030192.003013 |
Stewart H A, Jamieson A J, 2019. The five deeps: the location and depth of the deepest place in each of the world's oceans. Earth-Science Reviews, 197: 102896 DOI:10.1016/j.earscirev.2019.102896 |
Taira K, Kitagawa S, Yamashiro T et al, 2004. Deep and bottom currents in the Challenger Deep, Mariana Trench, measured with super-deep current meters. Journal of Oceanography, 60(6): 919-926 DOI:10.1007/s10872-005-0001-y |
Taira K, Yanagimoto D, Kitagawa S, 2005. Deep CTD casts in the Challenger Deep, Mariana Trench. Journal of Oceanography, 61(3): 447-454 DOI:10.1007/s10872-005-0053-z |
Talley L D, 1993. Distribution and formation of North Pacific intermediate water. Journal of Physical Oceanography, 23(3): 517-537 DOI:10.1175/1520-0485(1993)023<0517:DAFONP>2.0.CO;2 |
Talley L D, Feely R A, Sloyan B M et al, 2016. Changes in ocean heat, carbon content, and ventilation: a review of the first decade of GO-SHIP global repeat hydrography. Annual Review of Marine Science, 8: 185-215 DOI:10.1146/annurev-marine-052915-100829 |
Thompson A F, Gille S T, MacKinnon J A et al, 2007. Spatial and temporal patterns of small-scale mixing in Drake Passage. Journal of Physical Oceanography, 37(3): 572-592 DOI:10.1175/JPO3021.1 |
Thorpe S A, 1977. Turbulence and mixing in a Scottish Loch. Philosophical Transactions of the Royal Society A: Mathematical, and Physical and Engineering Sciences, 286(1334): 125-181 |
Todo Y, Kitazato H, Hashimoto J et al, 2005. Simple foraminifera flourish at the ocean's deepest point. Science, 307(5710): 689 DOI:10.1126/science.1105407 |
Turnewitsch R, Falahat S, Stehlikova J et al, 2014. Recent sediment dynamics in hadal trenches: evidence for the influence of higher-frequency (tidal, near-inertial) fluid dynamics. Deep Sea Research Part Ⅰ: Oceanographic Research Papers, 90: 125-138 DOI:10.1016/j.dsr.2014.05.005 |
Uchida H, Kawano T, Nakano T et al, 2020. An expanded batch-to-batch correction for IAPSO standard seawater. Journal of Atmospheric and Oceanic Technology, 37(8): 1507-1520 DOI:10.1175/JTECH-D-19-0184.1 |
Uchida H, Maeda Y, Kawamata S, 2018. Compact underwater slip ring swivel: minimizing effect of CTD package rotation on data quality. Sea Technology, 59(11): 30-32, https://lsc-pagepro.mydigitalpublication.com/publication/?m=60787&i=603285&p=30
|
Uchida H, Nakano T, Tamba J et al, 2015. Deep ocean temperature measurement with an uncertainty of 0.7 mK. Journal of Atmospheric and Oceanic Technology, 32(11): 2199-2210 DOI:10.1175/JTECH-D-15-0013.1 |
UNESCO, 1981. Background papers and supporting data on the International Equation of State of Seawater 1980. UNESCO Technical Papers in Marine Science No. 38, Paris, France: UNESCO, 192
|
Van Haren H, 2015. Ship motion effects in CTD-data from weakly stratified waters of the Puerto Rico trench. Deep Sea Research Part Ⅰ: Oceanographic Research Papers, 105: 19-25 DOI:10.1016/j.dsr.2015.08.002 |
Van Haren H, 2020. Challenger Deep internal wave turbulence events. Deep Sea Research Part Ⅰ: Oceanographic Research Papers, 165: 103400 DOI:10.1016/j.dsr.2020.103400 |
Van Haren H, Berndt C, Klaucke I, 2017. Ocean mixing in deep-sea trenches: new insights from the Challenger Deep, Mariana Trench. Deep Sea Research Part Ⅰ: Oceanographic Research Papers, 129: 1-9 DOI:10.1016/j.dsr.2017.09.003 |
Van Haren H, Laan M, 2016. An in-situ experiment identifying flow effects on temperature measurements using a pumped CTD in weakly stratified waters. Deep Sea Research Part Ⅰ: Oceanographic Research Papers, 111: 11-15 DOI:10.1016/j.dsr.2016.02.006 |
Van Haren H, Uchida H, Yanagimoto D, 2021. Further correcting pressure effects on SBE911 CTD-conductivity data from hadal depths. Journal of Oceanography, 77(1): 137-144 DOI:10.1007/s10872-020-00565-3 |
Wang F, Li Y L, Zhang Y H et al, 2013. The subsurface water in the North Pacific tropical gyre. Deep Sea Research Part Ⅰ: Oceanographic Research Papers, 75: 78-92 DOI:10.1016/j.dsr.2013.01.002 |
Wang J N, Ma Q, Wang F et al, 2020. Seasonal variation of the deep limb of the pacific meridional overturning circulation at Yap-Mariana junction. Journal of Geophysical Research: Oceans, 125(7): e2019JC016017 |
Whalen C B, MacKinnon J A, Talley L D et al, 2015. Estimating the mean diapycnal mixing using a finescale strain parameterization. Journal of Physical Oceanography, 45(4): 1174-1188 DOI:10.1175/JPO-D-14-0167.1 |
Whitt C, Pearlman J, Polagye B et al, 2020. Future vision for autonomous ocean observations. Frontiers in Marine Science, 7: 697 DOI:10.3389/fmars.2020.00697 |
Wolff T, 1959-1960. The hadal community, an introduction. Deep Sea Research (1953), 6: 95-124
|
Wunsch C, Ferrari R, 2004. Vertical mixing, energy, and the general circulation of the oceans. Annual Review of Fluid Mechanics, 36: 281-314 DOI:10.1146/annurev.fluid.36.050802.122121 |
Yancey P H, Gerringer M E, Drazen J C et al, 2014. Marine fish may be biochemically constrained from inhabiting the deepest ocean depths. Proceedings of the National Academy of Sciences of the United States of America, 111(12): 4461-4465 DOI:10.1073/pnas.1322003111 |
Yasuda I, Fujio S, Yanagimoto D et al, 2021. Estimate of turbulent energy dissipation rate using free-fall and CTD-attached fast-response thermistors in weak ocean turbulence. Journal of Oceanography, 77(1): 17-28 DOI:10.1007/s10872-020-00574-2 |
 2021, Vol. 52


